


 Invest ideas
News
21 May 2026, 09:45
Gold Holds Near Lows as Strong Dollar, Hawkish Fed Offset Iran Peace Uncertainty

BitcoinWorld Gold Holds Near Lows as Strong Dollar, Hawkish Fed Offset Iran Peace Uncertainty Gold prices remain under pressure in early trading this week, caught between a strengthening U.S. dollar and a hawkish shift from the Federal Reserve on one side, and lingering uncertainty over Iran peace negotiations on the other. The precious metal is struggling to find a clear direction as traders weigh competing macroeconomic and geopolitical forces. Dollar Strength and Fed Stance Weigh Heavily The U.S. dollar index has climbed to its highest level in several weeks, driven by robust economic data and comments from Federal Reserve officials signaling that interest rates may stay higher for longer. A stronger dollar typically makes gold more expensive for holders of other currencies, reducing demand. At the same time, the prospect of sustained high interest rates increases the opportunity cost of holding non-yielding assets like gold. Market participants are now pricing in a lower probability of rate cuts in the near term, a reversal from expectations earlier this year. This shift has been a key headwind for gold, which had rallied earlier in 2025 on hopes of a more accommodative Fed. Geopolitical Uncertainty Provides a Floor Despite the downward pressure from monetary policy and currency markets, gold’s decline has been limited by ongoing geopolitical risks. Talks aimed at securing a lasting peace agreement with Iran remain stalled, with both sides reporting little progress. The lack of a clear resolution keeps safe-haven demand alive, preventing a sharper sell-off. Analysts note that while the dollar and Fed narrative dominate short-term price action, the geopolitical backdrop continues to attract buyers on dips. The combination of these opposing forces has left gold trading in a relatively narrow range, with support near recent lows and resistance at higher levels tied to the dollar’s strength. What This Means for Investors For traders and long-term holders alike, the current environment underscores the importance of monitoring both macroeconomic data releases and geopolitical headlines. The Federal Reserve’s next policy meeting and any developments in Iran negotiations are likely to be the primary catalysts for gold’s next move. A break above or below the current range could signal the start of a more sustained trend. Conclusion Gold remains in a holding pattern, pressured by a strong dollar and hawkish Fed rhetoric but supported by geopolitical uncertainty tied to Iran peace talks. Until one of these forces clearly dominates, the precious metal is likely to continue trading in a range. Investors should stay alert to upcoming economic data and diplomatic developments for directional cues. FAQs Q1: Why is gold falling despite geopolitical tensions? Gold is being weighed down by a stronger U.S. dollar and expectations that the Federal Reserve will keep interest rates high. These factors typically reduce gold’s appeal as an investment, even when geopolitical risks are elevated. Q2: How does the Iran peace situation affect gold prices? Uncertainty around Iran peace talks creates safe-haven demand for gold, as investors seek a store of value during periods of geopolitical instability. If talks collapse or escalate tensions, gold could rally. If a deal is reached, safe-haven demand may fade. Q3: What should gold investors watch next? Investors should monitor U.S. economic data (especially inflation and employment reports), Federal Reserve statements, and news from Iran negotiations. These are the key drivers likely to determine gold’s next major move. This post Gold Holds Near Lows as Strong Dollar, Hawkish Fed Offset Iran Peace Uncertainty first appeared on BitcoinWorld .
21 May 2026, 09:35
Oil Prices Remain Elevated as Geopolitical Conflict Risk Persists: Commerzbank
BitcoinWorld Oil Prices Remain Elevated as Geopolitical Conflict Risk Persists: Commerzbank Commerzbank analysts have warned that the risk of geopolitical conflict continues to keep oil prices elevated, as supply disruptions and heightened tensions in key producing regions maintain upward pressure on crude markets. In a recent research note, the bank highlighted that while demand-side concerns linger, the immediate driver of current pricing remains the persistent threat of supply-side shocks stemming from unstable geopolitical landscapes. Conflict Premium and Supply Concerns The so-called conflict premium embedded in oil prices has proven stubbornly resilient. Commerzbank’s analysis points to ongoing instability in the Middle East, particularly around key chokepoints such as the Strait of Hormuz, as well as simmering tensions in Eastern Europe and parts of Africa. These regions collectively account for a significant share of global crude production and transit, meaning any escalation could rapidly tighten already balanced markets. Analysts note that despite efforts by OPEC+ to manage output, the organization’s spare capacity is increasingly concentrated in a few nations, making the global supply chain more vulnerable to localized disruptions. This structural fragility, according to Commerzbank, is a key reason why prices have not retreated further despite weaker-than-expected economic data from major consumers. Market Outlook and Price Forecasts Commerzbank’s commodity research team currently sees Brent crude trading in a range that reflects both upside risks from conflict and downside risks from slowing global growth. The bank has not issued a specific price target in this note but emphasizes that the balance of risks remains tilted to the upside as long as geopolitical flashpoints remain unresolved. For traders and investors, the implication is clear: oil markets are likely to remain sensitive to headlines from conflict zones, with any significant escalation capable of triggering sharp, short-term price spikes. Conversely, a sustained de-escalation could remove a substantial portion of the current premium, potentially driving prices lower. What This Means for Consumers and Businesses Elevated oil prices have a direct impact on fuel costs, transportation, and manufacturing, feeding into broader inflation dynamics. For businesses reliant on energy inputs, the current environment demands careful hedging and scenario planning. For central banks, persistent energy price pressure complicates the path to easing monetary policy, as it risks keeping headline inflation above target. Conclusion Commerzbank’s assessment underscores a fundamental reality in today’s oil market: geopolitics, not just supply-demand fundamentals, is the dominant price driver. Until the underlying conflicts show clear signs of resolution, the risk premium is likely to remain a fixture, keeping oil prices elevated above levels that pure economic data would suggest. Market participants should continue to monitor diplomatic developments as closely as inventory reports. FAQs Q1: Why does geopolitical conflict affect oil prices? Geopolitical conflict can disrupt oil production, transportation, or refining in key regions, creating supply shortages. Even the threat of disruption prompts traders to add a risk premium to prices, as they anticipate potential future supply losses. Q2: What specific conflicts is Commerzbank referring to? While the note does not name specific conflicts in detail, the bank references instability in the Middle East, Eastern Europe, and parts of Africa — regions that include major producers like Saudi Arabia, Iraq, Russia, and Nigeria, as well as critical transit routes. Q3: Could oil prices fall if conflicts de-escalate? Yes. A significant and credible de-escalation of major geopolitical tensions could remove the conflict premium, potentially leading to a rapid decline in oil prices. However, the timing and extent of such a move remain highly uncertain. This post Oil Prices Remain Elevated as Geopolitical Conflict Risk Persists: Commerzbank first appeared on BitcoinWorld .
21 May 2026, 09:34
A crypto whale has made a $224,000 bet that XRP's price stays perfectly flat through June

The trader collected about $224,500 in premiums and will keep the full amount if XRP remains close to $1.40.
21 May 2026, 09:30
BTC/USDT Spot CVD Chart Analysis: Volume Heatmap and Trade Size Trends on May 21
BitcoinWorld BTC/USDT Spot CVD Chart Analysis: Volume Heatmap and Trade Size Trends on May 21 On May 21, the BTC/USDT spot Cumulative Volume Delta (CVD) chart provided traders with a detailed view of order book dynamics, highlighting key price levels where volume concentration may act as support or resistance. The analysis, based on data as of 9:00 a.m. UTC, breaks down trade activity by size, offering insights into the behavior of both retail and large-scale participants. Understanding the Volume Heatmap The top section of the chart displays a Volume Heatmap, which tracks the volume of trades executed at specific price levels. The background color intensifies when the price remains within a certain range for an extended period or moves significantly. Brighter areas on the heatmap often indicate zones where traders have concentrated activity, making them potential support or resistance levels. For Bitcoin traders, these zones can serve as key reference points for entry or exit decisions. Cumulative Volume Delta by Trade Size The lower section of the chart features the Cumulative Volume Delta (CVD) indicator, which categorizes buy and sell orders by trade size. As buy orders increase, the corresponding colored line rises. The yellow line represents orders between $100 and $1,000, typically associated with retail traders. In contrast, the brown line tracks large orders between $1 million and $10 million, often linked to institutional or high-net-worth participants. Divergences between these lines can signal shifts in market sentiment or potential accumulation or distribution phases. Implications for Bitcoin Traders Monitoring CVD by trade size allows traders to distinguish between retail-driven movements and institutional activity. A rising brown line alongside a flat or declining yellow line may suggest that large players are accumulating, which could precede a breakout. Conversely, if retail buying dominates while large orders decline, the move may lack conviction. The heatmap further refines this picture by identifying price levels where volume clusters, helping traders set stop-losses or profit targets with greater precision. Conclusion The BTC/USDT spot CVD chart as of May 21 offers a granular look at market structure through volume concentration and trade-size distribution. For traders, combining the Volume Heatmap with CVD data provides a clearer understanding of where buying and selling pressure originates, and at what price levels the market is most active. As always, these tools are best used alongside broader market analysis and risk management strategies. FAQs Q1: What does the Volume Heatmap show in BTC/USDT trading? The Volume Heatmap displays the concentration of trading volume at specific price levels. Brighter areas indicate higher activity, which can act as potential support or resistance zones. Q2: How is the Cumulative Volume Delta (CVD) different from regular volume? Regular volume shows total trades, while CVD tracks the net difference between buy and sell orders, broken down by trade size, revealing the direction and strength of market participation. Q3: Why are trade sizes important in CVD analysis? Different trade sizes represent different types of traders. Small orders (yellow line) often reflect retail activity, while large orders (brown line) indicate institutional moves. Divergences can signal shifts in market sentiment. This post BTC/USDT Spot CVD Chart Analysis: Volume Heatmap and Trade Size Trends on May 21 first appeared on BitcoinWorld .
21 May 2026, 09:25
ZEC Hits $686 Amid $28M Liquidations as Analyst Warn of Coordinated Squeeze
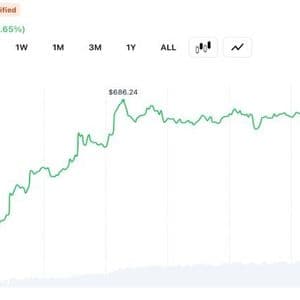
The privacy coin Zcash jumped over 17% in six hours, hitting a new year-to-date high on May 20. The rally pushed its monthly gains past 90% and its market capitalization over the $11 billion threshold, eclipsing rival monero. Zcash Hits New YTD High Privacy coin Zcash (ZEC) surged to a new year-to-date high on May
21 May 2026, 09:02
Google Gemini Sets XRP Price for June 1, 2026

As June 2026 approaches, interest in XRP’s short-term price outlook continues to rise among traders and digital asset investors. Market participants are closely watching regulatory developments, institutional activity, and overall crypto market sentiment to determine where XRP could be headed in the coming weeks. Artificial intelligence platforms are also increasingly being used to evaluate market conditions and generate price projections, with Google Gemini now offering its own outlook for XRP heading into June. Although no prediction can guarantee accuracy in the cryptocurrency market, AI-generated estimates are becoming an important source of market discussion. Google Gemini’s latest assessment comes at a time when XRP is attempting to stabilize after experiencing a wider crypto market correction earlier this year. As of mid-May 2026, XRP is trading around $1.38 and remains in a consolidation phase that analysts believe could influence its direction throughout the summer. Google Gemini Points to a Possible XRP Range Google Gemini stated that predicting the exact price of a volatile cryptocurrency on a specific date remains difficult because market conditions can change rapidly. However, the AI platform identified current technical indicators, institutional flows, and regulatory developments as major factors influencing XRP’s short-term movement. According to Google Gemini, “prominent crypto analysis platforms and institutional forecasts generally point to a tight consolidation range between $1.14 and $1.85, with the consensus average landing near $1.47 to $1.62” for June 1, 2026. The AI model also cited estimates from several crypto forecasting platforms. CoinDCX projected an average XRP price of $1.62 with a possible high of $1.85. CoinCodex estimated an average near $1.48, while Changelly targets $1.47. DigitalCoinPrice offered the most conservative estimate at roughly $1.14. Based on those combined projections, Google Gemini suggested XRP could trade near the middle of that range if current conditions remain stable through the end of May. Regulatory Developments Remain a Key Factor One of the biggest issues influencing XRP’s outlook is ongoing regulatory activity in the United States. The recently advanced Clarity Act has become a major topic across the cryptocurrency market after the Senate Banking Committee passed the bill on May 14. Investors are now waiting for the full Senate vote expected in June. Market analysts believe the legislation could improve confidence among institutional investors if approved. Google Gemini identified the Clarity Act as one of the main drivers behind XRP’s current momentum . The AI platform noted that optimism surrounding clearer digital asset rules has helped support market sentiment despite recent volatility. We are on X, follow us to connect with us :- @TimesTabloid1 — TimesTabloid (@TimesTabloid1) June 15, 2025 ETF Activity and Technical Levels Could Shape June Trading Institutional investment products connected to XRP are also contributing to market speculation. Spot XRP exchange-traded funds have reportedly accumulated around $1.3 billion in assets under management since launch. Earlier this month, daily inflows reportedly reached $25.8 million, showing continued institutional interest in the asset. According to Google Gemini, steady ETF inflows could become one of the strongest catalysts for XRP heading into June. The platform stated that continued institutional buying pressure may help XRP challenge the $1.60 resistance level if momentum strengthens during the final weeks of May. Technical indicators are also receiving close attention from traders. Analysts continue to monitor the 200-day moving average, which currently sits near $1.45. Holding above the wider $1.40 to $1.45 support zone is considered important for maintaining upward momentum. A drop below that range, however, could expose XRP to additional downside pressure toward the $1.25 area. Despite the uncertainty surrounding cryptocurrency forecasting, Google Gemini’s latest assessment reflects growing expectations that XRP could remain relatively stable through early June unless major economic or regulatory events significantly change market conditions. Disclaimer : This content is meant to inform and should not be considered financial advice. The views expressed in this article may include the author’s personal opinions and do not represent Times Tabloid’s opinion. Readers are advised to conduct thorough research before making any investment decisions. Any action taken by the reader is strictly at their own risk. Times Tabloid is not responsible for any financial losses. Follow us on X , Facebook , Telegram , and Google News The post Google Gemini Sets XRP Price for June 1, 2026 appeared first on Times Tabloid .


