


News
20 May 2026, 19:55
Bitcoin’s 200-Day MA Rejection Echoes 2022 Bear Market Pattern, Analyst Warns

BitcoinWorld Bitcoin’s 200-Day MA Rejection Echoes 2022 Bear Market Pattern, Analyst Warns Bitcoin’s recent failure to break above its 200-day moving average (MA) at $82,400 and subsequent drop to $76,000 mirrors the early stages of the 2022 bear market, according to a new analysis from CryptoQuant. The development has raised concerns among traders that the current rally may be a temporary relief bounce rather than the start of a sustained uptrend. Technical Resistance at a Critical Level Julio Moreno, Head of Research at CryptoQuant, noted that Bitcoin faced the same technical resistance after rallying approximately 37% from its recent low. Historically, the 200-day MA has served as a boundary between a relief rally and a resumption of a downtrend. “The failure to break this resistance indicates the bear market is structurally ongoing,” Moreno explained. The pattern closely resembles what occurred in March 2022, when a similar rejection preceded a prolonged period of price declines. Fading Demand Signals Moreno pointed to several indicators that suggest weakening demand. Futures market activity, which drove the rally in April and May, has slowed significantly amid liquidations of long positions after the price surpassed $82,000. Spot demand is also declining rapidly. Spot Bitcoin ETFs have turned to net outflows, and the Coinbase Premium — a key gauge of institutional buying pressure — has become negative. “A positive Coinbase Premium is typical in a sustained bull market, making the current situation a negative price indicator,” Moreno said. What This Means for Bitcoin Investors The combination of technical resistance and fading demand suggests that Bitcoin may face further downside in the near term. Moreno warned that such periods have historically been followed by additional price declines or sideways movement. If the correction continues, the next key support level is expected at $70,000, which represents the average cost basis for short-term investors. A break below that level could signal deeper losses, though it may also attract buying from those looking to accumulate at lower prices. Conclusion Bitcoin’s rejection at the 200-day MA is a significant technical event that aligns with historical bear market patterns. While a relief rally offered temporary optimism, the underlying demand metrics paint a cautious picture. Traders and investors should monitor the $70,000 support level closely, as it could determine the next major move for the cryptocurrency. The coming weeks will be critical in confirming whether this is a temporary setback or the beginning of a deeper correction. FAQs Q1: Why is the 200-day moving average important for Bitcoin? The 200-day moving average is a widely followed technical indicator that represents the long-term trend. A break above it is often seen as bullish, while a rejection is considered bearish, signaling potential further declines. Q2: What is the Coinbase Premium and why does it matter? The Coinbase Premium measures the price difference between Bitcoin on Coinbase Pro and other exchanges. A positive premium indicates strong buying pressure from institutional investors, while a negative premium suggests weakening demand. Q3: What is the next support level for Bitcoin if the correction continues? According to CryptoQuant, the next key support level is $70,000, which is the average cost basis for short-term investors. This level has historically acted as a floor during corrections. This post Bitcoin’s 200-Day MA Rejection Echoes 2022 Bear Market Pattern, Analyst Warns first appeared on BitcoinWorld .
20 May 2026, 19:36
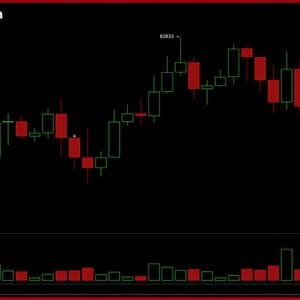
Price predictions 5/20: BTC, ETH, BNB, XRP, SOL, DOGE, HYPE, ADA, ZEC, BCH

Bitcoin looks on track for a rally toward $80,000 while HYPE, ZEC and a handful of altcoins are pushing toward their range highs.
20 May 2026, 19:30
Pundit Predicts What Will Happen To XRP When Exchanges Run Out Of Supply

XRP’s supply mechanism is one of the most controversial talking points in the crypto market. XRP exchange reserves have been falling for months, and the on-chain numbers are glaring. Now, a crypto pundit on X is connecting that structural shift to a chain of events that could send the XRP price into territory the market has never seen. XRP Supply Shock Could Push Exchanges Into A Liquidity Crisis A crypto pundit known as DelCrxpto has added an interesting angle to a scenario where XRP demand overwhelms available exchange supply and forces a new liquidity structure around Ripple’s XRP reserves. Whenever demand rises faster than available supply, price must adjust. XRP could eventually reach a point where exchanges struggle to source enough spot supply to meet demand from buyers, institutions, and liquidity providers. Related Reading: Trillion-Dollar Italian Bank Moves To XRP, But How Much Have They Bought? The pundit predicted that exchanges will eventually run out of XRP supply, demand will explode, and the entire XRP supply ecosystem could even face the risk of freezing. However, he believes such a squeeze would not only affect price but also force the market to create new liquidity channels from derivative contracts. Interestingly, the pundit also predicted that Ripple will step in by deploying portions of its XRP reserve as a liquidity pool and issuing XRP derivative contracts to exchanges. These exchanges would then sell the contracts at market price, allowing Ripple to earn yield from the structure. What’s Going On With The Supply? The current XRP circulating supply shows why the idea of exchanges completely running out of XRP should be treated carefully. At the time of writing, CoinMarketCap puts XRP’s circulating supply at about 61.82 billion XRP. However, the most important question is not how much XRP exists in circulation, but how much of that supply is actually liquid and available for immediate sale on exchanges. Recent on-chain data has started to strengthen the argument that XRP’s liquid supply may be tightening. For instance, the amount of XRP held on Binance has reportedly fallen from about 3.05 billion tokens to below 2.75 billion in less than a year, putting the exchange’s XRP reserves near multi-year lows. Related Reading: What’s Going On With Ethereum And Why Is Price Moving This Way? The drop in wallet balance of XRP has also coincided with a rise in XRP holders. Wallet addresses holding at least 10,000 XRP have reached a new all-time high of 332,000 wallets, showing that larger holders are still building positions despite XRP’s volatile price action. Another important signal is coming from whale exchange activity. Data has shown that XRP’s biggest holders have slowed the rate at which they send tokens to crypto exchanges. The 30-day cumulative whale inflow indicator has fallen below 736 million XRP, its lowest level since November 2021. Featured image created with Dall.E, chart from Tradingview.com
20 May 2026, 19:30
Bitcoin Seeing A Crucial Shift In Demand Dynamics While Price Action Weakens

As volatility persists in the market, Bitcoin faces a potential retest of the $70,000 price level following the recent pullback. With this waning price action, demand for the flagship asset among investors and traders is exhibiting a trend that could spell trouble for its near-term direction. Demand Patterns For Bitcoin Are Undergoing A Change Bitcoin continues to struggle with heightened bearish pressure, and a subtle but crucial shift is currently emerging in the market. Currently, BTC’s downside price action has begun to reflect changes in its demand dynamics. In an analysis of the Bitcoin Spot and Perpetual Futures Demand Growth, Julio Moreno has shared that BTC’s total demand entered into a contraction phase on Monday, May 18. This shift comes after a steady upside since early March this year, driven by speculative demand. With fading buying pressure and cooling speculative activity colliding , this development triggered concerns about whether the market is either getting ready for a wider trend reversal or is about to enter a consolidation phase. Moreno highlighted that speculative demand growth, which is represented by the blue bars on the chart, reached its highest level as prices approached the $80,000 mark. However, this activity has since slowed down significantly. Meanwhile, spot demand, indicated as the grey bars on the chart, is contracting slightly faster than the speed of the cooling speculative demand. As demand patterns continue to adjust, this could play a role in shaping BTC’s next major move in either direction. BTC Held At Loss Matching Past Levels During this weakening momentum, another development that is drawing attention is the number of Bitcoins held at a loss. According to Darkfost, another CryptoQuant author, the supply of BTC held at a loss by long-term holders is not 5.7 million BTC, matching levels previously seen at the peak of past bear markets. In 2015, it was 5.96 million BTC, in 2019, it was 5.8 million BTC, while in 2022, it was 6.8 million BTC. It is worth noting that the most severe discomfort was felt by LTHs during the last cycle. Nonetheless, the recent 52% decline in Bitcoin is still significantly lower than what was observed in earlier bear markets. Darkfost stated that this suggests a very large number of BTC was exchanged between $80,000 and $126,000, and the losses are probably present among the youngest cohort of LTHs. What’s important here is that the trend is not completely confirmed yet, but a slight distortion caused by the movement of 800,000 BTC from Coinbase on November 21 and 22 was observed. Furthermore, a spike of more than 740,000 BTC can clearly be seen around April 21 and 22, while on Bitbo, the transaction to long-term holders occurs after 155 days. By adjusting the figure for this movement, the value could still be around 4.93 million BTC, which remains historically significant. In the following 3 to 4 days, Darkfost noted that a number of LTH-related measures on platforms that use a 6-month threshold may also begin to move quickly. At that point, these BTC, which moved around $84,500, will officially shift from STH to LTH supply.
20 May 2026, 19:28
Bitfinex Analysts Warn $85,900 BTC Resistance Could Cap Any Recovery Rally
Bitcoin traders absorbed $584 million in long liquidations on Monday as geopolitical pressure and rising Treasury yields dragged the price toward a key onchain support level, according to Bitfinex analysts. BTC Longs Drop $584M in One Session as Bitcoin Tests May Monthly Open Support The sell-off came as Donald Trump posted on social media about
20 May 2026, 19:10
South Korean funeral firm loses $33M of customer prepayments on leveraged crypto ETF

Bumo Sarang, a South Korean funeral mutual aid company, recorded 49.3 billion won ($33 million) in unrealized losses after an audit revealed where it was investing its customers’ prepayment funds. The money was put into a leveraged cryptocurrency ETF tied to Bitmine (NYSE: BMNR), where it crashed and lost over half of its value. An investigation launched into South Korean funeral mutual aid companies revealed that 43% of them hold fewer assets than given to them by customers. Bumo Sarang’s crypto gamble goes wrong South Korea’s funeral mutual aid model works on advance payments. Customers pay upfront to lock in the cost of future funeral services, accumulating pools of capital that companies are expected to hold conservatively. Bumo Sarang, whose name translates roughly to “love for parents,” and is the seventh-largest funeral service provider in South Korea, poured approximately $40 million (59.5 billion won) into a risky bet on crypto. The company invested in the T-REX 2X Long BMNR Daily Target ETF (BMNU), a product designed to double the daily price movement of Bitmine Immersion Technologies (NYSE: BMNR). Cryptopolitan previously reported that Bitmine is the world’s largest corporate holder of Ethereum, with 5.2 million ETH on its balance sheet valued at roughly $12.3 billion. Bitmine purchased over 100,000 ETH per week at its peak before recently slowing to 26,659 ETH in its latest buy. By the end of 2025, Bumo Sarang’s investment book value had crashed to just $6.8 million (10.2 billion won), leaving the funeral company with a staggering 49.3 billion won in unrealized loss. Leveraged ETFs amplify gains and losses equally, so any given trading day, a decline in BMNR stock hits Bumo Sarang’s position at twice the magnitude. Due to the repeated price swings, the products suffer from extreme volatility and have had their value eroded over time, even when the underlying asset ends flat. Bumo Sarang’s initial 59.5 billion won investment fell to a book value of just 10.2 billion won after market declines, producing the 49.3 billion won loss figure. A company representative called it a “short-term unrealized loss” and said it was within the company’s “financial buffer.” What is the ‘zombie’ funeral crisis? An investigative review of 75 South Korean funeral mutual aid companies found that 32 of them, roughly 43%, hold total assets below the sum of their customer advance payments. That gap means these companies may not be able to honor their obligations if large numbers of customers cancel. Local media have described this as a “Zombie Sangjo” (zombie mutual aid) crisis. South Korean funeral companies are supervised by the Fair Trade Commission rather than financial regulators , meaning they face no capital adequacy requirements and no solvency thresholds. Under current law, these companies only need to keep 50% of customer prepayments “safe.” The other half can be invested in almost anything, including leveraged crypto ETFs. Korea Economic Daily reported that this lack of oversight extends across a market worth an estimated 10 trillion won. Investigators also flagged a pattern of related-party lending, where some funeral companies issued loans to major shareholders in amounts exceeding total customer payments. As of May 2026, six legislative proposals are pending to restrict how these companies invest funds and to ban loans to major shareholders. If you're reading this, you’re already ahead. Stay there with our newsletter .


