


 Invest ideas
News
19 May 2026, 06:00
Bitcoin Spot Demand Falters as Options Market Tilts Bearish: Glassnode

BitcoinWorld Bitcoin Spot Demand Falters as Options Market Tilts Bearish: Glassnode Bitcoin’s recent price recovery from the high $60,000s to over $82,000 appears to be losing steam, according to a weekly report from on-chain analytics firm Glassnode. The leading cryptocurrency has since corrected back to the $77,000 range, and data from the report suggests the upward momentum is not being supported by strong spot market conviction. Key On-Chain Indicators Point to Weakening Sentiment Glassnode’s analysis highlights several metrics that signal a shift in market dynamics. The most striking is the Spot Cumulative Volume Delta (CVD), which has experienced a sharp 848.7% decline. This metric measures the net difference between market buy and sell orders, and such a dramatic drop indicates a significant increase in selling pressure. While spot trading volume did increase by 4.2%, the data suggests this activity was not driven by aggressive buying interest but rather by distribution. In the derivatives market, futures open interest (OI) decreased by 2.9%, pointing to a slight reduction in overall leverage. However, the picture is more nuanced. Funding rates for long positions surged by 136.6%, a sign that some traders are still willing to pay a premium to maintain bullish bets. This creates a divergence: while some participants are betting on further upside, the broader market is showing signs of caution. Options Market Flashes a Warning The most significant bearish signal comes from the options market. The 25-delta skew, a key measure of demand for puts versus calls, rose by 42.8%. This increase reflects a growing preference for downside hedging, as traders seek protection against potential price declines. This shift in options positioning is often a leading indicator of changing market sentiment and suggests that professional traders are bracing for further downside risk. Institutional Demand Shows Signs of Cooling Adding to the cautious outlook, Glassnode noted that net inflows into U.S. spot Bitcoin ETFs are slowing. These investment vehicles have been a major driver of institutional demand and price appreciation over the past year. A deceleration in inflows could dampen the broader institutional sentiment that has been a key pillar of the recent rally. Without sustained buying pressure from these large-scale investors, the market may find it difficult to reclaim and hold higher price levels. Conclusion The combination of a collapsing spot CVD, rising downside hedging in the options market, and cooling ETF inflows paints a picture of a market at a crossroads. While pockets of bullish leverage remain, the prevailing data from Glassnode suggests that the path of least resistance may be shifting to the downside. For traders and investors, these on-chain signals serve as a critical reminder to monitor the underlying health of demand, rather than relying solely on price action. FAQs Q1: What is the Spot Cumulative Volume Delta (CVD)? A1: It is an on-chain metric that measures the net difference between the volume of market buy orders and market sell orders. A declining CVD indicates that selling pressure is outweighing buying pressure. Q2: What does a rising 25-delta skew in options mean? A2: It indicates increased demand for put options (bets on a price decline) relative to call options (bets on a price increase), signaling that traders are hedging against downside risk. Q3: Why are Bitcoin ETF inflows important? A3: U.S. spot Bitcoin ETFs provide a regulated way for institutional and retail investors to gain exposure to Bitcoin. Strong inflows generally signal high demand and can drive prices higher, while slowing inflows can indicate waning interest. This post Bitcoin Spot Demand Falters as Options Market Tilts Bearish: Glassnode first appeared on BitcoinWorld .
19 May 2026, 05:48
Ethereum Price Stabilizes After Selloff, But Bears Still Hold Advantage

Ethereum price started a fresh decline and traded below $2,120. ETH is now consolidating above $2,050 and might struggle to recover. Ethereum remained in a bearish zone after a sharp decline. The price is trading below $2,165 and the 100-hourly Simple Moving Average. There is a connecting trend line forming with support at $2,020 on the hourly chart of ETH/USD (data feed via Kraken). The pair could continue to move down if it stays below the $2,200 zone. Ethereum Price Consolidates Losses Ethereum price failed to remain stable above $2,200 and started a downside correction, like Bitcoin . ETH price dipped below the $2,165 and $2,150 levels. The price even traded below $2,020. A low was formed at $1,914 on Kraken, and the price is now attempting to recover most losses. There was a recovery wave above the 61.8% Fib retracement level of the downward move from the $2,198 swing high to the $1,914 low. Ethereum price is now trading below $2,165 and the 100-hourly Simple Moving Average . Besides, there is a connecting trend line forming with support at $2,020 on the hourly chart of ETH/USD. If the bulls remain in action above $2,020, the price could attempt another increase. Immediate resistance is seen near the $2,150 level or the 83.2% Fib retracement level of the downward move from the $2,198 swing high to the $1,914 low. The first key resistance is near the $2,175 level. The next major resistance is near the $2,200 level. A clear move above the $2,200 resistance might send the price toward the $2,250 resistance. An upside break above the $2,250 region might call for more gains in the coming days. In the stated case, Ether could rise toward the $2,320 resistance zone or even $2,350 in the near term. Another Drop In ETH? If Ethereum fails to clear the $2,150 resistance, it could start a fresh decline. Initial support on the downside is near the $2,090 level. The first major support sits near the $2,050 zone. A clear move below the $2,050 support might push the price toward the $2,020 support. Any more losses might send the price toward the $1,940 region. The main support could be $1,920. Technical Indicators Hourly MACD – The MACD for ETH/USD is losing momentum in the bearish zone. Hourly RSI – The RSI for ETH/USD is now above the 50 zone. Major Support Level – $2,020 Major Resistance Level – $2,190
19 May 2026, 05:46
Ripple CTO Explains XRPL Hard Forks

Ripple Chief Technology Officer David Schwartz has addressed concerns over the XRP Ledger's (XRPL) frequent "technical hard forks."
19 May 2026, 05:46
ONDO surges higher: can bulls push the token past $0.50 soon?

The cryptocurrency market is having a relief pump following days of massive selloff. Bitcoin remains below $77,000, but the leading altcoins have embarked on a solid recovery. Ethereum (ETH), the leading altcoin by market cap, is approaching the $2,200 level once again, while Hyperliquid (HYPE) leads the rally with a 6% pump. However, ONDO, the native coin of Ondo Finance, is the best performer among the top 50 cryptocurrencies by market cap. ONDO is up 13% in the last 24 hours, with the bulls now targeting the 4-hour swing high above $0.48. Momentum indicators have also flipped bullish, suggesting that buyers are now in control. Ondo Finance’s tokenized stocks TVL hits $1.5 billion ONDO is trading at $0.388 at press time on Tuesday, up by 13% over the past 24 hours. The primary catalyst behind ONDO’s rally is the announcement by Ondo Finance that its tokenized stocks TVL has hit the $1.5 billion mark. According to Ondo Finance, this growth highlights the increasing demand for on-chain access to equities and exchange-traded funds. The team revealed that the five largest assets by TVL include CRCLon (Circle), IVVon (S&P 500 ETF), MUon (Micron), NVDAon (Nvidia), and IBITon (Bitcoin ETF). Together, these five tokenized securities account for approximately 25% of the entire tokenized stock market on the platform. https://twitter.com/OndoFinance/status/2056396415392215434 The concentration reflects strong investor appetite for blue-chip technology stocks, major index funds, and crypto-linked ETFs. This latest development comes amid rising demand for tokenized stocks. By converting stocks and ETFs into blockchain-based tokens, Ondo Finance and similar platforms allow investors to enjoy near-instant transfers and 24/7 trading in these stocks. This feature brings stocks trading to DeFi and opens up new use cases, such as using tokenized stocks as collateral in lending markets or integrating them into automated portfolio strategies. On the derivatives side, retail demand for ONDO has increased massively over the past 24 hours. Data obtained from CoinGlass reveals that ONDO’s futures Open Interest (OI) now reads $196 million, up 13% from the $162 million recorded on Monday. However, the OI-weighted funding rate remains negative and reads -0.0030, indicating that the bears are not yet out of the market. ONDO price outlook: ONDO bulls target the $0.50 psychological level The ONDO/USD 4-hour chart is bullish and efficient as Ondo Finance is up by 13% in the last 24 hours. The coin briefly dropped to the $0.33 level on Monday following the recent dip, grabbing the 4-hour Inducement Liquidity (ILQ) before resuming its rally. The momentum indicators suggest that the bulls are now in control. The RSI of 61 shows that ONDO is bullish but has yet to enter the overbought region, suggesting further room for growth. The MACD lines also entered the positive zone during the New York session on Monday, adding further bullish confluence to the narrative. If the rally persists, ONDO could surge towards the 4-hour swing high of $0.4883 and target the $0.5000 psychological level. A daily candle close above this level could allow ONDO to target the next major resistance level at $0.544 for the first time since November. However, if the bears regain control, the Monday low of $0.3300 could serve as the initial support level. Failure to defend this level could see ONDO drop towards the 4-hour Transactional Liquidity (TLQ) at $0.3159. The post ONDO surges higher: can bulls push the token past $0.50 soon? appeared first on Invezz
19 May 2026, 05:45
SEC Prepares to Allow Trading Tokenized Stocks on Crypto Platforms
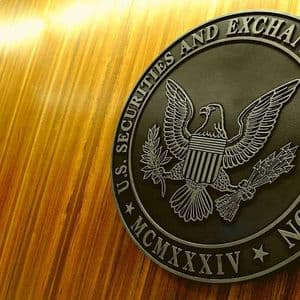
The SEC is set to release a so-called “innovation exemption” for tokenized stocks, which will pave the way for trading digital versions of securities, reported Bloomberg on Tuesday. The agency’s framework for tokenized stock trading under the Trump administration’s direction is expected to be finalized this week, the anonymous sources told the outlet. These tokenized assets would also be tradeable on decentralized crypto platforms in a move that could “reshape the landscape of the American stock market,” it reported. Huge Shift in US Crypto Infrastructure Under Chair Paul Atkins, the SEC has signaled support for tokenization since mid-2025, including exemptions to accelerate on-chain securities trading, aligning with broader US policy to lead in digital assets. The SEC is leaning toward allowing trading of tokens that do not have the backing or consent of the public companies whose shares they track, reported Reuters. These tokens may not provide traditional shareholder rights, such as voting power or dividends, the report added. The move could be one of the biggest shifts into crypto infrastructure yet, paving the way for 24/7 trading of digital securities, potential DeFi integration for equities, and growth in platforms handling tokenized assets. DeFi analyst Ignas said it was bullish for multiple assets, including ONDO, CFG, PENDLE, and HYPE, as well as lending markets that accept tokenized collateral, such as AAVE, MORPHO, and FLUID. Tokenization is shifting from plans to policy in a structural shift that will enable round-the-clock trading and decentralized rails. “We’ve entered a global race to tokenize money and capital markets,” commented Token Terminal. “The economic advantages of asset tokenization are too good to ignore, which is why we believe that all other major nations and economic zones will try to follow the US playbook when it comes to stablecoins and asset tokenization.” Tokenized Stocks Remain Small Tokenized stocks comprise a small piece of the larger tokenized real-world asset pie with just $1.45 billion, or 4.3% share of distributed TVL, according to RWA.xyz. Tokenized US Treasuries make up the lion’s share with 46% of $15.5 billion, and Ethereum is the blockchain of choice with a market share exceeding 60% (including layer-2s) of all tokenized RWA. The post SEC Prepares to Allow Trading Tokenized Stocks on Crypto Platforms appeared first on CryptoPotato .
19 May 2026, 05:43
Bitmine buys 71,672 ETH as price drops 8.7 percent

🚀 Bitmine grabbed 71,672 ETH amid an 8.7 percent price drop. In just one week, Bitmine grew its $ETH portfolio beyond 5.2 million coins. 🧐 Key point: Bitmine is targeting 5 percent of Ether’s total circulating supply by 2026. Continue Reading: Bitmine buys 71,672 ETH as price drops 8.7 percent The post Bitmine buys 71,672 ETH as price drops 8.7 percent appeared first on COINTURK NEWS .

