


News
11 May 2026, 11:52
XRP Price Outperforms ETH and BTC: $2 Next Target as Ripple Token Eyes $10
XRP price is trading at $1.46, up 2% in 24 hours, and quietly outpacing both Bitcoin and Ethereum on a relative basis. The move builds on a breakout through $1.43 resistance that held traders hostage for weeks, and the volume behind it was anything but big. The breakout accelerated yesterday when volume surged above $3.6 billion and forced the price through the $1.43 ceiling. XRP briefly tagged $1.50 before profit-taking pulled it back toward $1.45. XRP FUNDS SEE STRONG INFLOWS AS CLARITY ACT HYPE GROWS $XRP investment products recorded $39.6 million in weekly inflows (May 4 – May 8), CoinShares says. The inflows came as digital asset funds attracted $857.9 million last week. Bitcoin $BTC led the market with $706.1… pic.twitter.com/CmHDP4Fggq — BSCN (@BSCNews) May 11, 2026 Meanwhile, network activity and institutional adoption metrics have been accelerating in parallel, adding structural weight to the technical setup. Bitcoin sits at $81,000, and Ethereum is stalling at $2,330. Both are consolidating, and both also need triple-digit percentage gains to reach analyst targets. Discover: The best crypto to diversify your portfolio with Can XRP Price Hit $2 Short-Term, and Is $10 A Realistic Target? XRP is holding above the prior breakout zone at $1.44–$1.45, which has flipped from resistance to support. As long as the price stays above it, the bullish thesis remains intact. Immediate resistance sits at $1.50, where sellers returned aggressively after the session high. A sustained close above $1.50 reopens momentum toward $1.60 first, then the $1.80 zone. The scenario map breaks down cleanly. If XRP absorbs the $1.50 rejection, it could consolidate in a tight range to reclaim $1.50 on volume, which targets $1.80 and eventually $2.35 resistance. In this scenario, a breakout at that level points toward $3–$5. Xrp (XRP) 24h 7d 30d 1y All time We place the $10 trajectory in the context of XRP’s 580% surge from $0.50 to $3.40 between late 2024 and January 2025, a move that established the asset’s capacity for violent repricing. The $10 target is not fringe. A trader consensus is building around $10 before 2026 closes, citing regulatory clarity post-SEC settlement, RippleNet expansion, and Ripple Payments adoption by firms including Rakuten. Discover: The best pre-launch token sales LiquidChain Presale Approaches $750K as Cross-Chain Infrastructure Gains Attention XRP’s outperformance reflects a market rotation into assets with clear utility narratives and institutional catalysts. But now, already more than 200% above its 2024 pre-surge levels, the asymmetric upside available to late entrants is structurally compressed compared to what early holders captured. That gap is driving renewed interest in early-stage infrastructure plays where price discovery has barely begun. LiquidChain is one project attracting that attention. Positioned as a Layer 3 cross-chain infrastructure layer, it fuses Bitcoin, Ethereum, and Solana liquidity into a single execution environment. It is here, solving the fragmentation problem that forces traders and developers to manage separate positions across disconnected ecosystems. The final layer emerges. LiquidChain is the future. ⟁ https://t.co/vqvBcdSQYC pic.twitter.com/gAhIyFxdXV — LiquidChain (@getliquidchain) May 10, 2026 The presale is currently priced at $0.01458 per $LIQUID token, with $750K raised to date, and 1470% APY staking bonus. Key architecture features include a Unified Liquidity Layer, Single-Step Execution, Verifiable Settlement, and a Deploy-Once Architecture that lets developers access BTC, ETH, and SOL ecosystems without redeployment overhead. Explore LiquidChain’s presale details here . The post XRP Price Outperforms ETH and BTC: $2 Next Target as Ripple Token Eyes $10 appeared first on Cryptonews .
11 May 2026, 11:45
Elon Musk New Grok AI Predicts the Price of XRP by The End of 2026
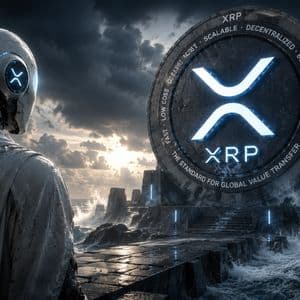
We fed Grok AI a carefully engineered prompt about XRP price action to find out what it predicts. What came back was not a cautious hedge. It was a number that would make most analysts uncomfortable putting their name on. The AI did not blink. By the end of 2026, it sees XRP printing somewhere between $4 and $7, with an optimistic run potentially pushing past that entirely if the right conditions stack up. Grok’s AI reasoning is not random. It anchors the call on 3 converging factors that are already in motion. The SEC case is resolved, regulatory clarity no longer hangs over the asset, and XRP ETFs are now attracting real institutional money. That alone changes the demand equation. Layer on Ripple’s expanding On-Demand Liquidity partnerships, driving actual XRPL volume, and you have utility backing the speculation rather than speculation alone. Source: Grok AI XRP Price Prediction The macro setup adds to it: rate cuts, RWA tokenization momentum, and XRP’s structural advantage in cross-border payments put it directly in the path of capital that is actively looking for somewhere to go. The base target Grok lands on is $3.50 to $5. The optimistic scenario is $7 or higher by year-end, representing a 3 to 5x move from current levels. That is the kind of setup that only works if institutional demand shows up consistently and ETF inflows do not stall. The bear case is real, though. If ETF momentum slows or stablecoin competition starts eating into XRP’s payments niche, the more likely outcome is a prolonged grind between $1.50 and $2.50. Not a collapse, but not the breakout either. The prediction is high conviction, not guaranteed. Xrp (XRP) 24h 7d 30d 1y All time Is Grok AI XRP Price Prediction Realistic? Here Is What the Chart Says About his Predicts XRP is trading at $1.45 on the daily, sitting inside a descending wedge that has been tightening since the February lows around $1.20. The pattern is textbook. Lower highs, higher lows, price coiling toward the apex. A descending wedge is a bullish reversal structure by nature, and the chart has it drawn out clearly with the breakout projection pointing toward the $3.73 area, roughly a 164% move from the current XRP USD price. Resistance sits at $1.55 to $1.60, which is where the upper trendline of the wedge is currently pressing down. That zone has rejected price multiple times since February, and it is the level that matters most right now. Support is $1.30, the floor that has held through every flush since the wedge formed. Lose that, and the bullish structure breaks down. RSI on the daily is at 51.21, sitting just above the midline. That is neutral, not extended, and actually leaves room for a real move without hitting overbought territory immediately. The signal line is tracking above at 58.08, which suggests the momentum side of the indicator is tilting bullish even if the XRP price has not confirmed yet. The wedge breakout would need a clean daily close above $1.60 with volume behind it. If that happens, $2.00 is the first target, and the path toward Grok’s base case starts looking a lot less speculative. Discover: The best crypto to diversify your portfolio with Grok Projects That Bitcoin Hyper Could Outperform Them All Some traders rotating between cycles are already looking past large caps entirely. Bitcoin Hyper is positioning itself for that rotation. The project is building the first Bitcoin Layer 2 with Solana Virtual Machine integration, claiming sub-Solana latency while keeping Bitcoin’s security layer intact. Fast, low-cost smart contracts on Bitcoin without abandoning its trust model. That is a gap neither Ethereum nor Solana fills directly. The presale has raised $32 million at $0.013679 per token with high APY staking available for early participants. The risk profile is different here. Higher upside potential, earlier entry, and significantly more execution risk than anything trading on major exchanges. That tradeoff is the whole point. Research Bitcoin Hyper here. The post Elon Musk New Grok AI Predicts the Price of XRP by The End of 2026 appeared first on Cryptonews .
11 May 2026, 11:37
Bitcoin Signals Key On-Chain Recovery as Profitability Hits Strongest Level Since October 2024
Bitcoin sees increased profit-taking activity as recent market spikes put sellers in profit while price retains the $80,000 level.
11 May 2026, 11:35
Gold Price Slides to $4,650 as Markets Reassess Fed Rate Cut Timeline

BitcoinWorld Gold Price Slides to $4,650 as Markets Reassess Fed Rate Cut Timeline Gold prices extended their decline on Tuesday, with XAU/USD touching fresh lows near $4,650 per troy ounce, as diminishing expectations for an early Federal Reserve rate cut strengthened the U.S. dollar and pushed bond yields higher. The move marks a significant pullback from recent highs and reflects a broader recalibration of monetary policy expectations among traders and institutional investors. Why Gold Is Under Pressure The primary catalyst for gold’s weakness is the shift in market pricing for Federal Reserve policy. After a series of stronger-than-expected economic data releases — including resilient employment figures and sticky inflation readings — traders have scaled back bets on a rate cut in the first half of 2025. According to CME FedWatch data, the probability of a quarter-point cut at the May meeting has fallen below 30%, down from over 60% just a month ago. Higher interest rates increase the opportunity cost of holding non-yielding assets like gold, making it less attractive compared to interest-bearing instruments. Simultaneously, a stronger dollar — which tends to move inversely to gold — has added further headwinds. The U.S. Dollar Index (DXY) climbed to a three-week high above 104.50 during Tuesday’s session, pressuring commodities priced in the greenback. Technical Picture: Support Levels in Focus From a technical perspective, gold’s break below the $4,700 support zone has opened the door for further downside. The $4,650 level represents a key near-term support, corresponding to the 50-day simple moving average. A decisive close below this threshold could expose the next major support near $4,580, which aligns with the 100-day moving average. Resistance now sits at $4,720, followed by $4,780. The Relative Strength Index (RSI) on the daily chart has dipped below 50, indicating that bearish momentum is building. However, oversold conditions on shorter timeframes could trigger a temporary bounce before the broader downtrend resumes. What This Means for Investors For precious metals investors, the current environment demands caution. The repricing of Fed rate expectations has removed a key tailwind for gold, and unless incoming economic data weakens materially, the path of least resistance may remain lower in the near term. That said, gold’s role as a portfolio diversifier and hedge against geopolitical uncertainty remains intact. Long-term holders may view this pullback as an accumulation opportunity, particularly if central bank buying continues at the pace seen in 2024. Broader Market Context The sell-off in gold is part of a broader repricing across asset classes. Equities have also faced headwinds, with the S&P 500 slipping as rate-sensitive sectors like real estate and utilities underperform. Meanwhile, the 10-year Treasury yield rose to 4.35%, its highest level since November, further dampening the appeal of non-yielding assets. In the commodity space, silver has followed gold lower, dropping 2.5% to $29.80 per ounce, while platinum and palladium have also posted losses. The broader precious metals complex is clearly reacting to the same macro forces: a hawkish repricing of Fed policy and a strengthening dollar. Conclusion Gold’s decline to $4,650 reflects a market adjusting to a higher-for-longer interest rate environment. While the short-term outlook appears bearish, the longer-term case for gold — supported by central bank demand, geopolitical tensions, and fiscal concerns — remains intact. Investors should watch upcoming U.S. economic data, particularly the January consumer price index (CPI) and retail sales reports, for further clues on the Fed’s next move. FAQs Q1: Why does gold price fall when Fed rate cut expectations decline? Gold is a non-yielding asset, meaning it does not pay interest or dividends. When the Fed is expected to keep rates higher for longer, the opportunity cost of holding gold increases relative to interest-bearing assets like bonds, prompting investors to sell. Q2: What is the next key support level for gold? The next major support is near $4,580, which corresponds to the 100-day simple moving average. A break below that could open the door to the $4,500 psychological level. Q3: Should investors buy gold at current levels? That depends on individual risk tolerance and investment horizon. Short-term traders may wait for clearer signs of a bottom, while long-term investors may see the pullback as a buying opportunity, especially if they believe the Fed will eventually cut rates later in 2025. This post Gold Price Slides to $4,650 as Markets Reassess Fed Rate Cut Timeline first appeared on BitcoinWorld .
11 May 2026, 11:30
OSMO Surges Over 200% as Bithumb Trading Dominates, On-Chain Data Shows Little Change
BitcoinWorld OSMO Surges Over 200% as Bithumb Trading Dominates, On-Chain Data Shows Little Change Osmosis (OSMO), the native token of the decentralized exchange Osmosis, experienced a dramatic price surge of over 200% in the past 24 hours, briefly reaching $0.128 before settling around $0.105, according to data from BlockBeats and CoinGecko. The sudden spike has drawn significant attention from traders and analysts, particularly due to the concentration of trading activity on a single centralized exchange. Exchange Volume Concentration Raises Questions CoinGecko data reveals that OSMO’s global 24-hour spot trading volume reached approximately $175 million. A striking 30% of this volume—around $55.8 million—originated from the South Korean exchange Bithumb. In comparison, Binance accounted for 22.4% of the total volume. This heavy reliance on a single exchange for price discovery is unusual for a token native to a decentralized finance (DeFi) ecosystem. Further underscoring the anomaly, data from DeFiLlama shows that OSMO’s trading volume on decentralized exchanges (DEXs) was a mere $1.24 million during the same period. This massive discrepancy between centralized and decentralized trading volumes suggests the price movement may be driven more by specific market dynamics on Bithumb than by organic demand within the Osmosis ecosystem. On-Chain Fundamentals Remain Stable Despite the sharp price increase, on-chain fundamentals for the Osmosis network have shown no significant changes. Key metrics such as total value locked (TVL), stablecoin market capitalization, and fund inflows have remained relatively flat, according to available data. This lack of fundamental support typically raises caution among long-term investors, as it implies the price surge may not be sustainable. What This Means for Traders For traders and investors, the current situation highlights the importance of looking beyond headline price movements. While a 200% gain is eye-catching, the concentration of volume on a single exchange and the absence of on-chain growth suggest the rally may be speculative or driven by specific trading patterns rather than broad-based adoption or network expansion. Monitoring Bithumb’s order book and trading activity will be crucial in the coming days to assess whether the momentum can be maintained. Conclusion The OSMO price surge is a textbook example of how centralized exchange volume can temporarily decouple a token’s price from its underlying network fundamentals. While the rally has generated significant short-term trading opportunities, the lack of corresponding growth in TVL and DEX activity suggests caution is warranted. Investors should continue to watch for any changes in on-chain metrics or exchange volume distribution to gauge the sustainability of this move. FAQs Q1: Why did OSMO surge over 200%? The surge was primarily driven by a massive increase in trading volume on the South Korean exchange Bithumb, which accounted for 30% of global spot trading. The exact catalyst remains unclear, but it appears to be a concentrated buying event rather than organic ecosystem growth. Q2: Is the OSMO price surge sustainable? On-chain fundamentals, including TVL and stablecoin market cap, have not changed significantly. This suggests the rally may be speculative and could be vulnerable to a sharp correction if Bithumb trading activity subsides. Q3: What should investors watch next? Key indicators include Bithumb’s trading volume and order book depth, as well as any changes in Osmosis’s on-chain metrics like TVL and DEX volume. A shift in volume back to decentralized exchanges or an increase in network activity would be more positive signs for long-term price stability. This post OSMO Surges Over 200% as Bithumb Trading Dominates, On-Chain Data Shows Little Change first appeared on BitcoinWorld .
11 May 2026, 11:30
What’s Going On With The XDC Altcoin And Why Did It Just Surpass Bitcoin?

Crypto pundit X Finance Bull has highlighted the XDC altcoin, noting that it recently surpassed Bitcoin on CoinMarketCap as the most-visited coin. The pundit explained why the altcoin is getting much attention and why it could see significant growth in the near future. Pundit Explains What Is Happening With XDC After Surpassing Bitcoin In an X post , X Finance Bull noted that XDC just surpassed Bitcoin as the most-visited crypto on CoinMarketCap over the last seven days. He remarked that although most people have never heard of the altcoin, the surge in attention is not random. The pundit further explained that something is building beneath this token that the crypto market hasn’t fully processed yet. The pundit noted that the XDC network was built to digitize the $2.5 trillion trade finance gap , which is the space between what small and medium businesses need to borrow and what banks are willing to lend. He added that this gap exists because trade finance still runs on paper documents, manual verification, and multi-day settlement. X Finance Bull declared that XDC replaces all of this with a blockchain designed from the ground up for institutional trade. He highlighted features such as 2,000 TPS, 2-second finality, near-zero fees, KYC-verified masternodes, and ISO 20022 compliant , which is the same messaging standard SWIFT and other central banks use. The pundit added that the XDC team includes André Casterman, who worked at SWIFT for over 20 years before joining XDC. Other Positives For The Altcoin X Finance Bull noted that crypto custodian BitGo provides regulated institutional custody on the XDC network. Furthermore, Liqi is said to process over $100 million in daily trade finance volume on the network. Meanwhile, Singapore’s TradeTrust uses the network for MLETR-compliant digital trade documents. Other notable adoption of the network includes ComTech Gold’s launch of sharia-compliant tokenized gold last month. AUDDapt has also partnered for SME payments in Australia. Additionally, X Finance Bull noted that Circle’s USDC is bridged on the network. At the same time, the SEC and CFTC have classified the token as a digital commodity through their Token Taxonomy guidance. The pundit also pointed to the Cancun hard fork in January, which he noted aligned XDC with Ethereum’s latest standards, including EIP-1559 for predictable fees. He added that XDC 2.0 introduced Byzantine fault tolerance with forensic monitoring, a capability developed by Princeton University Professor Pramod Viswanath. With the altcoin currently boasting a market cap of around $635 million, the pundit believes the token remains undervalued. He said that trade finance is a multi-trillion-dollar market and that the most-visited token on CoinMarketCap is trading at around $0.03. At the time of writing, the XDC price is trading at around $0.03, up over 7% in the last 24 hours, according to data from CoinMarketCap.


