


News
25 Mar 2026, 11:00
USD/INR Retracement: How Middle East Ceasefire Hopes Spark Dramatic Risk-On Reversal

BitcoinWorld USD/INR Retracement: How Middle East Ceasefire Hopes Spark Dramatic Risk-On Reversal The USD/INR currency pair experienced significant retracement today as renewed hopes for a Middle East ceasefire underpinned a dramatic shift toward risk-on sentiment across global markets. This movement represents a notable reversal from recent safe-haven flows that had bolstered the US dollar against emerging market currencies throughout early 2025. Market participants globally are now reassessing positions amid evolving geopolitical developments. Consequently, the Indian rupee strengthened against the dollar during Asian trading hours. This shift follows weeks of heightened tension that had pressured emerging market assets. Financial analysts are closely monitoring the situation for sustained momentum changes. USD/INR Technical Retracement Analysis The USD/INR pair retreated from recent highs as ceasefire optimism emerged. Specifically, the currency pair moved from 83.45 to 83.12 during the session. This represents a clear technical correction within the prevailing trend. Market technicians note key support and resistance levels are now in focus. Meanwhile, trading volumes increased substantially during the move. Several factors contributed to this retracement pattern. Therefore, traders are watching for confirmation of a broader trend reversal. Technical indicators showed notable shifts during the session. The Relative Strength Index (RSI) moved from overbought territory toward neutral levels. Additionally, moving averages provided dynamic support during the decline. The 50-day moving average currently sits at 82.95. Consequently, this level represents immediate technical support. Bollinger Bands also expanded slightly during the volatility. However, the overall trend structure remains intact pending further developments. Key Technical Levels for USD/INR Level Type Significance 83.50 Resistance Previous session high 83.12 Current Session low point 82.95 Support 50-day moving average 82.75 Support Psychological level Middle East Ceasefire Developments and Market Impact Diplomatic efforts intensified this week toward a potential ceasefire agreement. Multiple sources confirmed progress in negotiations between involved parties. Specifically, mediators reported constructive dialogue on several key issues. This development follows months of intermittent conflict that disrupted global trade routes. Consequently, energy markets showed immediate relief with oil prices declining. The Brent crude benchmark fell approximately 2.5% on the news. The geopolitical shift triggered broad market reactions across asset classes. Emerging market currencies generally strengthened against the US dollar. Similarly, equity markets in Asia and Europe posted gains during the session. Safe-haven assets like gold and US Treasuries experienced selling pressure. This collective movement signals a clear risk-on rotation among institutional investors. Market participants are now pricing in reduced geopolitical risk premiums. Several key factors drove the market’s optimistic interpretation: Diplomatic progress: Multiple parties confirmed substantive negotiations Timeline clarity: Potential agreement framework within weeks Regional stability: Reduced threat to critical shipping lanes Economic implications: Lower energy costs and improved trade flows Risk-On Sentiment Resurgence in Global Markets The shift toward risk appetite manifested across multiple financial markets simultaneously. Asian equities led the advance with benchmarks gaining 1-2%. European markets opened higher following the positive developments. Meanwhile, US index futures pointed to a stronger opening on Wall Street. This coordinated movement reflects interconnected global market dynamics. Currency markets particularly showed sensitivity to the changing sentiment. Emerging market assets benefited disproportionately from the risk-on rotation. Local currency bonds attracted substantial foreign inflows during the session. Additionally, equity funds dedicated to emerging markets reported increased subscriptions. The MSCI Emerging Markets Index consequently outperformed developed market benchmarks. This pattern historically accompanies improving geopolitical conditions. Market analysts note similar reactions during previous conflict de-escalations. Expert Analysis on Market Psychology Financial institutions provided immediate analysis of the market movements. Goldman Sachs analysts noted “a clear repricing of geopolitical risk premiums.” Meanwhile, JPMorgan highlighted “improved sentiment toward emerging market carry trades.” These assessments reflect professional market consensus. Historical data supports the correlation between geopolitical stability and risk appetite. Therefore, sustained progress could support further emerging market strength. Market psychology shifted notably during the trading session. Fear gauges like the VIX index declined significantly. Similarly, credit default spreads tightened across emerging market sovereign debt. These technical indicators confirm genuine sentiment improvement rather than temporary positioning adjustments. Consequently, the moves may have lasting implications for portfolio allocations. Institutional investors are reportedly reviewing emerging market exposure targets. Indian Economic Context and Currency Implications The Indian rupee’s movement occurs within specific domestic economic conditions. Recent inflation data showed moderation toward Reserve Bank of India targets. Additionally, foreign direct investment flows remained robust through early 2025. The country’s current account deficit also narrowed in recent quarters. These fundamental factors support currency stability amid global volatility. Therefore, the rupee may demonstrate relative strength during risk-on periods. Monetary policy considerations influence currency valuation expectations. The Reserve Bank of India maintained its benchmark rate at 6.5% during the last meeting. However, policymakers indicated potential easing later in 2025 if inflation remains controlled. This relatively hawkish stance compared to other emerging markets supports the rupee. Meanwhile, economic growth projections remain above 6% for the fiscal year. These factors combine to create favorable conditions for currency appreciation. Several structural elements support the Indian rupee: Foreign reserves: Exceed $600 billion providing intervention capacity Growth differential: Outperforms many emerging market peers Policy stability: Consistent monetary and fiscal frameworks Diversified economy: Reduced commodity dependency compared to peers Historical Precedents and Comparative Analysis Historical market reactions provide context for current movements. Previous geopolitical de-escalations triggered similar currency responses. For example, the 2015 Iran nuclear deal prompted emerging market currency rallies. Similarly, Korean peninsula tensions easing in 2018 boosted risk assets. These precedents suggest potential sustained momentum if ceasefire progress continues. However, past episodes also show vulnerability to diplomatic setbacks. Comparative analysis reveals interesting patterns across currency pairs. The USD/INR movement paralleled other dollar pairs during the session. Specifically, USD/MXN and USD/ZAR showed similar retracement patterns. This correlation confirms broad dollar weakness rather than rupee-specific strength. Meanwhile, Asian currency baskets generally outperformed other emerging market groupings. Regional economic integration may amplify these relative performances. Institutional Positioning and Flow Analysis Market flow data reveals institutional behavior during the session. Hedge funds reportedly reduced dollar-long positions significantly. Meanwhile, real money accounts increased emerging market currency exposure. These flows suggest conviction behind the risk-on rotation. Trading volume analysis confirms broad participation rather than isolated speculation. Consequently, the moves reflect genuine repricing rather than technical adjustments alone. Positioning data from the Commodity Futures Trading Commission shows interesting trends. Speculative net positions in rupee futures shifted toward less bearish positioning. Similarly, options market volatility skews normalized during the session. These technical indicators support continued rupee stability. Market makers report balanced order flows following initial volatility. This suggests sustainable rather than exaggerated price action. Forward Outlook and Key Monitoring Points The forward trajectory depends on several evolving factors. Ceasefire negotiations require continued progress toward formal agreement. Any diplomatic setbacks could reverse recent market movements. Additionally, broader macroeconomic conditions influence currency valuations. US Federal Reserve policy remains particularly important for dollar direction. Therefore, multiple variables will determine sustained trends. Market participants should monitor several specific developments: Diplomatic statements: Official announcements regarding ceasefire progress Energy prices: Oil market reactions to geopolitical developments Dollar index: Broad dollar strength or weakness patterns Risk indicators: VIX and credit spread movements Indian data: Domestic economic releases and policy decisions Technical analysis suggests important levels for the USD/INR pair. Sustained movement below 83.00 could signal broader trend reversal. Conversely, recovery above 83.50 would indicate failed breakout attempts. Volume confirmation will validate either scenario. Market structure currently favors range-bound trading pending clearer directional catalysts. Conclusion The USD/INR retracement reflects broader market repricing of geopolitical risks amid Middle East ceasefire hopes. This movement demonstrates how currency markets rapidly incorporate changing global conditions. The Indian rupee benefited from both improved risk sentiment and supportive domestic fundamentals. However, sustained appreciation requires continued diplomatic progress and stable macroeconomic conditions. Market participants should monitor multiple factors for directional clarity. The USD/INR pair remains sensitive to both geopolitical developments and broader dollar trends. FAQs Q1: What caused the USD/INR retracement? The primary driver was renewed optimism about a Middle East ceasefire, which reduced demand for safe-haven assets like the US dollar and boosted risk appetite for emerging market currencies including the Indian rupee. Q2: How does geopolitical stability affect currency markets? Geopolitical stability typically reduces risk premiums, encouraging capital flow toward higher-yielding emerging market assets and weakening safe-haven currencies like the US dollar against riskier counterparts. Q3: What technical levels are important for USD/INR? Key levels include resistance at 83.50 (previous session high), current trading around 83.12, support at the 50-day moving average (82.95), and psychological support at 82.75. Q4: How does this affect Indian importers and exporters? A stronger rupee benefits importers by reducing foreign currency costs, while exporters face reduced rupee earnings from foreign sales, potentially impacting trade competitiveness. Q5: Could this retracement reverse quickly? Yes, currency movements based on geopolitical developments can reverse rapidly if ceasefire hopes diminish or other risk factors emerge, highlighting the importance of monitoring diplomatic progress. This post USD/INR Retracement: How Middle East Ceasefire Hopes Spark Dramatic Risk-On Reversal first appeared on BitcoinWorld .
25 Mar 2026, 10:57
Shiba Inu Rally Gains Steam Amid $49M Open Interest Spike and Bullish Setup

Shiba Inu delivered its strongest price performance in weeks as improving macro sentiment triggered a broad relief rally across global markets. Notably, Shiba Inu ranks among the key beneficiaries of the renewed risk appetite, supported by a notable surge in derivatives activity that signaled fresh trader interest. Visit Website
25 Mar 2026, 10:54
Bitcoin retakes $71K as US sends Iran 15-point ceasefire plan

Bitcoin bounced back above $71,000 after US President Donald Trump’s administration sent a proposal to Iran aimed at ending the war.
25 Mar 2026, 10:52
Solana Price Prediction: Is SOL Done? Will Memecoin Season Back to Solana?

Solana price is fighting to hold crucial ground, currently trading between $90 and $ 93 as traders watch for a definitive directional move and a bullish prediction. Despite a sharp contraction in DEX volumes, technical structures against Bitcoin are flashing potential outperformance signals. There is a tightening wedge pattern on the SOL/BTC pair, with the asset pushing against horizontal resistance while respecting a rising trendline. This setup, often a precursor to volatility, coincides with the anticipated Alpenglow consensus upgrade targeting sub-second finality. The market now faces a binary decision point: reclaim $100 or surrender the $80 psychological floor. SOL BTC, TradingView As liquidity rotates across the meme coin sector, Solana’s ability to maintain its position as the premier casino chain is under scrutiny due to contracting on-chain activity. Discover: The best pre-launch token sales Solana Price Prediction: Can SOL Reclaim $100 Before Month End? The technical landscape for Solana remains precarious yet opportunistic. Currently hovering near $91, SOL faces immediate resistance at the Bollinger upper band of $92. A confirmed close above this level exposes the next targets at $98, effectively invalidating the bearish pressure accumulating since the January peak of $148. Conversely, the downside carries significant risk; a head-and-shoulders pattern is also identified at 4 hours chart, and it suggests a breakdown below the $80 critical support could trigger a slide toward $59. SOL USD, TradingView Momentum indicators offer little clarity, with the RSI oscillating between 51 and 55, a classic neutral consolidation signal. However, the SOL/BTC pairing tells a different story. A breakout attempt from a multi-month ascending triangle, suggesting capital may rotate back into Solana’s ecosystem if Bitcoin stabilizes above $72k. Discover: The best crypto to diversify your portfolio with Bitcoin Hyper Targets Early Mover Upside as Solana Tests Key Levels While Solana battles strictly defined resistance levels with limited immediate upside, smart money is increasingly hunting for infrastructure plays with higher aggressive growth potential. The market’s appetite for speed is shifting toward the Bitcoin ecosystem itself. Why settle for Solana’s volatility when you can access similar speeds on the world’s most secure blockchain? From a humble beginning… To Hyper Scale. https://t.co/VNG0P4GuDo pic.twitter.com/TTkNzelKN3 — Bitcoin Hyper (@BTC_Hyper2) March 23, 2026 Enter Bitcoin Hyper ($HYPER) , the first-ever Bitcoin Layer 2 utilizing the Solana Virtual Machine (SVM). This project aims to solve Bitcoin’s notorious latency issues by delivering sub-second transaction speeds directly on the Bitcoin network, effectively bringing Solana’s programmability to Bitcoin’s security. The presale data reflects massive institutional interest, with more than $32 million raised from early backers. Priced at just $0.0136 , $HYPER offers a low-entry alternative and a 36% APY staking rewards . With features like a Decentralized Canonical Bridge and significant staking APY, it targets the liquidity trapped in the BTC ecosystem. Research the Bitcoin Hyper Presale Disclaimer: This article is not financial advice. Cryptocurrency markets are highly volatile. Always do your own research (DYOR) before investing. The post Solana Price Prediction: Is SOL Done? Will Memecoin Season Back to Solana? appeared first on Cryptonews .
25 Mar 2026, 10:50
Polkadot (DOT) Price Prediction 2026-2030: The Critical Path to a $60 Milestone
BitcoinWorld Polkadot (DOT) Price Prediction 2026-2030: The Critical Path to a $60 Milestone As of March 2025, the blockchain interoperability sector faces both immense opportunity and significant technical challenges. Within this landscape, analysts and investors consistently scrutinize the future valuation of major protocols like Polkadot (DOT). This analysis provides a structured examination of the factors that could influence the DOT price trajectory from 2026 through 2030, specifically addressing the feasibility of reaching the $60 threshold. Polkadot Price Prediction: Foundation in Network Fundamentals Any credible price prediction for Polkadot must first anchor itself in the protocol’s underlying technology and adoption metrics. The core value proposition of Polkadot lies in its heterogeneous multi-chain framework. This architecture allows specialized blockchains, known as parachains, to interoperate securely within the Polkadot ecosystem. Consequently, the network’s health is not measured by transaction volume alone but by parachain slot auctions, active developers, and cross-chain message volume. Market analysts often correlate DOT’s long-term value with the success and utility of its parachains. Projects like Acala (DeFi), Moonbeam (EVM compatibility), and Astar Network drive real economic activity. The number of fully deployed parachains and the demand for future slots through crowdloan mechanisms provide tangible, verifiable data points. Furthermore, the implementation of key technological upgrades, such as asynchronous backing and Agile Coretime, directly impacts network scalability and efficiency. These fundamentals form the bedrock for any projection. Historical Context and Market Cycle Analysis Understanding past performance within broader market cycles offers crucial context for future Polkadot price predictions. DOT’s price history exhibits high volatility, closely tied to general cryptocurrency market sentiment and Bitcoin’s macro trends. For instance, the 2021 bull market saw DOT achieve an all-time high near $55, a level that serves as a key psychological and technical benchmark. However, the subsequent bear market demonstrated the asset’s sensitivity to reduced risk appetite and liquidity outflows from the digital asset space. Financial institutions like JPMorgan Chase have published research noting the maturation of the blockchain sector, with a shift from pure speculation to utility-based valuation. This evolving paradigm suggests that future price appreciation for assets like DOT may become more gradual and fundamentally driven compared to previous cycles. Analysts therefore examine on-chain metrics, such as the ratio of active addresses to price and staking participation rates, to gauge organic growth versus speculative froth. Expert Perspectives on Valuation Models Leading cryptocurrency research firms employ various models to forecast asset prices. For Polkadot, common methodologies include discounted cash flow analysis based on projected network fee revenue, comparisons to the market capitalization of similar interoperability solutions like Cosmos (ATOM), and Metcalfe’s Law-based evaluations of network growth. A report from Messari in Q4 2024 highlighted that DOT’s valuation relative to the total value locked (TVL) across its parachains was a critical ratio to watch. Furthermore, experts from institutions like CoinShares regularly emphasize the importance of regulatory developments. Clearer regulations for staking and decentralized governance, particularly in major markets like the United States and the European Union under MiCA, could reduce systemic risk premiums and attract institutional capital. This external factor is a significant variable in any long-term price model for DOT from 2026 onward. The Road to $60: Scenario Analysis for 2026-2030 The question of whether the DOT price can reach $60 involves analyzing multiple converging scenarios. A $60 price point implies a market capitalization significantly higher than current levels, requiring substantial new capital inflow and network growth. The following table outlines key conditional factors: Bull Case Scenario Base Case Scenario Bear Case Scenario Massive adoption of parachains for enterprise and government use. Steady, organic growth in DeFi and NFT projects within the ecosystem. Prolonged crypto winter or adverse regulatory action. Successful scaling via next-gen relay chain upgrades. Moderate increase in developer activity and cross-chain volume. Technical setbacks or security vulnerabilities in the protocol. Institutional ETFs or investment products focused on DOT. Continued staking participation rates above 50%. Loss of market share to competing layer-0 or interoperability protocols. For the bull case to materialize, several conditions must align. First, the broader cryptocurrency market would need to enter a sustained growth phase, likely driven by Bitcoin ETF adoption and macroeconomic conditions favorable to risk assets. Second, Polkadot must successfully execute its technology roadmap, notably improving cross-chain composability without sacrificing security. Finally, the ecosystem requires a “killer app”—a parachain application that drives unprecedented user adoption and transaction demand, thereby increasing the utility and fee-burning mechanisms for DOT. Comparative Landscape and Competitive Threats No analysis of Polkadot’s future price is complete without assessing the competitive landscape. The blockchain interoperability space is fiercely contested. Key competitors include: Cosmos (ATOM): Focuses on an internet of blockchains with the Inter-Blockchain Communication (IBC) protocol. Avalanche (AVAX): Offers subnets for custom blockchain creation with a different security model. Layer-2 Rollup Ecosystems: Solutions like Arbitrum and Optimism create scalable environments within Ethereum, potentially reducing the immediate need for standalone parachains. Polkadot’s shared security model, where parachains lease security from the central Relay Chain, remains a key differentiator. However, this model’s success depends on the continued value and security of the DOT token itself. If competing frameworks offer comparable interoperability with lower barriers to entry or greater flexibility, they could capture market share. Therefore, monitoring developer migration and grant funding across these ecosystems provides leading indicators for DOT’s competitive position through 2030. Conclusion In summary, the path for the Polkadot (DOT) price between 2026 and 2030 is intrinsically linked to the network’s fundamental growth, its competitive execution, and the macro environment for digital assets. Reaching a $60 price point is a plausible outcome under a specific set of optimistic conditions, including widespread parachain adoption, successful technological scaling, and a favorable regulatory climate. However, this target remains highly speculative and contingent upon factors beyond mere historical extrapolation. Investors and observers should prioritize monitoring on-chain metrics, governance decisions, and ecosystem development over short-term price movements to assess DOT’s long-term trajectory accurately. FAQs Q1: What is the most important factor for Polkadot’s price growth by 2030? The single most critical factor is the tangible, utility-driven adoption of its parachain ecosystem. Price sustainability will rely on real-world applications generating fees and demand for DOT’s staking and governance functions, not just speculative trading. Q2: How does Polkadot’s inflation rate affect its price prediction? DOT has a designed, adaptive inflation rate used to reward stakers. High staking participation can offset selling pressure from inflation. Long-term models must account for whether new demand can outpace the new token supply entering the market each year. Q3: Could a Bitcoin bull market alone push DOT to $60? While a strong Bitcoin bull market would likely lift all major altcoins, including DOT, a move to $60 based solely on crypto-wide euphoria would likely be unstable. A lasting achievement of that price level requires Polkadot-specific fundamentals to support the higher valuation. Q4: What are the biggest risks to this Polkadot price prediction? The primary risks include catastrophic smart contract or protocol-level security failures, a prolonged loss of developer mindshare to competing ecosystems, and unexpectedly harsh global regulations targeting staking or decentralized governance models. Q5: Where can I find reliable data to track Polkadot’s progress? Independent data aggregators like DotLake, Subscan, and the Polkadot Wiki provide real-time metrics on parachains, staking, governance, and network activity. These resources offer the factual backbone for ongoing personal analysis. This post Polkadot (DOT) Price Prediction 2026-2030: The Critical Path to a $60 Milestone first appeared on BitcoinWorld .
25 Mar 2026, 10:45
Bitcoin nears $72,000 as rising open interest signals growing leverage in choppy market
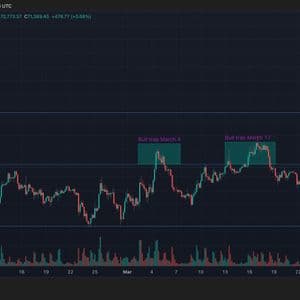
BTC rises with equities while surging open interest and fading volatility point to leveraged positioning despite repeated rejections near $72,000.


