


News
27 Mar 2026, 13:24
VIRTUAL Technical Analysis 27 March 2026: Support Resistance Levels

VIRTUAL primary support at the 0.65$ level near 0.6430$; if it holds, movement to 0.6838$ resistance possible. In case of breakdown, 0.5909$ and 0.5436$ supports critical, BTC downtrend affecting a...
27 Mar 2026, 13:19
Cardano drops to $0.24, is ADA set for a steeper decline?

Cardano’s slide to near $0.24 on Friday has injected fresh investor concern, with the token underperforming alongside sharp pullbacks in Bitcoin and Ethereum. The move, which has seen the ADA price down 4% in the past 24 hours and 9% this past week, has revived fears that the bear phase may yet have another leg down. For bulls, the question is whether ADA faces a deeper retreat toward long-term support. Cardano slides amid broad market weakness ADA’s drop to $0.24 coincides with renewed selling pressure across the crypto market. Friday saw the benchmark assets, Bitcoin, break lower, with BTC retreating toward $66,500 and Ethereum under $1,990. Other cryptocurrencies also slipped, with XRP to $1.32, Solana to $83, and BNB to $610. The move for the top coins cascaded across the rest of the market, with Cardano’s losses pushing it to support levels seen earlier in the week. Notably, the declines are a part of the wider de‑risking that also sees stocks trade sideways or lower. Could ADA dip further? Heightened geopolitical tensions compound the technical headwinds for the Cardano price. As investors hedge against potential downward momentum, the unwinding is hurting sentiment. However, analysts at Santiment say the growing negative crowd chatter signals a possible upside flip. The short-term technical perspective, however, has ADA probing the support zone amid a death cross pattern on the weekly chart. Sellers are showing strength near an area that has repeatedly acted as a year‑to‑date floor, which could be at risk. Cardano chart by TradingView Notably, each prior revisit of this area has attracted dip buyers and short‑covering. This has allowed prices to stabilize and stage modest rebounds. However, prevailing sentiment is negative. Recently, Santiment highlighted that nearly 50% of ADA holders are underwater after a 75% fall from its local peek in 2025. These kinds of losses and the broader pessimism could hinder any sustained bullish response, and things could get worse if $0.25 caves in amid further macroeconomic and geopolitical shocks. An extended breakdown below $0.25 would be technically significant and could open the door to a sharper decline toward $0.20 - a price level last seen in 2020. Such a move would nonetheless likely flush out late‑cycle holders and put bulls on the path to a medium‑term uptick and consolidation. Key Cardano-related news Cardano has witnessed some bullish news this week, and the overall sell-off may taper off as a result. Cardano Foundation has voted for key governance proposals. Meanwhile, Hashdex has expanded its Nasdaq CME Crypto Index ETF, adding ADA to its holdings. Cardano is now among the 7 cryptocurrencies in the ETF, alongside Bitcoin, Ethereum, XRP, Solana, Chainlink, and Stellar. Also notable is the recent execution of the first atomic swap between Cardano and Bitcoin, with native BTC swapped directly for native ADA. The post Cardano drops to $0.24, is ADA set for a steeper decline? appeared first on Invezz
27 Mar 2026, 13:18
Solana price outlook: sell-side pressure builds toward $80 support
After trading above $91 in early March, Solana (SOL) has seen repeated rejection around that range. The price is currently hovering around $84, indicating a short-term decline from recent highs. Solana had surged past $96 following Trump’s announcement that the United States was pausing its intended attacks on Iran’s energy and power infrastructure, but afterwards slid back below $90. Technical analysis SOL’s recent price action shows that $91, once a support level, has once again turned into a strong resistance. Every attempt to move above it since February has been met with selling pressure. The short-term moving averages have also tilted downward, reflecting the prevailing bearish sentiment. Volume has also dropped noticeably. Reduced trading activity often signals weaker conviction among buyers, giving sellers the upper hand. On-chain activity has mirrored this trend, with decentralised exchange activity and network transactions showing signs of slowing. Momentum indicators are not helping either. The relative strength index (RSI) has been hovering below neutral, while the Moving Average Convergence Divergence (MACD) indicator suggests that bearish pressure remains dominant. Solana price chart | Source: TradingView From the above, the overall pattern indicates a market that has traded in a tight consolidation since February and is currently leaning toward further downside rather than immediate recovery. In the derivatives market, short-term traders have also been active, with funding rates negative and a larger proportion of positions held on the short side. Source: Coinglass This adds to the pressure, as leveraged positions can magnify price swings during declines. The key Solana price levels to watch SOL’s price outlook for the coming days is dominated by a tug-of-war between cautious buyers and aggressive sellers. The market remains reactive, and the next move will largely depend on whether support near around $80 and $82 can hold. A drop below this range could open the door for deeper losses, with analysts hinting at the possibility of the altcoin revisiting levels in the mid-$70s. Notably, breaking these levels could trigger stop-loss orders and further accelerate the downward move. Despite the bearish outlook, some longer-term scenarios remain cautiously optimistic. If SOL stabilises near $80 and buyers regain confidence, it could consolidate before attempting another breakout at the immediate resistance located around $90 to $96. Fundamental catalysts, such as network upgrades or renewed investor interest, may help reverse the trend over time. However, the immediate environment favours caution. The current setup suggests that selling pressure is likely to continue until buyers can overcome key resistance levels and stabilise the price. The post Solana price outlook: sell-side pressure builds toward $80 support appeared first on Invezz
27 Mar 2026, 13:11
BLOX Vs. LFGY: A Review As Performance Diverges From Expectations, And Bitcoin Crashes Further

Summary BLOX retains a buy rating, while LFGY is rated hold, reflecting superior long-term risk-reward asymmetry. BLOX’s structurally higher crypto exposure drives underperformance in corrections but offers amplified upside in rebounds, supported by a resilient option overlay. LFGY’s less aggressive crypto allocation and more aggressive option strategy yield better downside protection and higher short-term income, but less upside capture. Despite recent drawdowns, both ETFs significantly outperformed spot Bitcoin, validating covered call strategies for income investors seeking volatility mitigation. Since I wrote about moving to the Nicholas Crypto Income ETF ( BLOX ) from the YieldMax Crypto Industry & Tech Portfolio Option Income ETF ( LFGY ) in November last year, Bitcoin has collapsed by another ~23%. Some part of this drawdown explains why BLOX has underperformed LFGY, as we will see in the analysis. However, the extent of drawdown mitigation we have seen in the option-based income variants over spot Bitcoin points to market factors at play in the crypto-adjacent businesses that should be reviewed. Overall, while the performance outcomes have not panned out as per my ratings, this analysis will show why there is still merit in sticking with the same strategy in the current regime - buy BLOX and hold LFGY. Data by YCharts The Mechanisms Expected Have Played Out Between the two, BLOX is expected to have more severe drawdowns if the underlying crypto space is going through a corrective phase. Its appeal lies in higher upside opportunity capture versus LFGY that more than compensates for the drawdown differential. This is what I wrote in my earlier analysis LFGY's emphasis on income means better performance in consolidating or bearish markets, but not so much in bullish cycles. So LFGY being down by only ~7.5%, around 4 percentage points less than how BLOX has corrected in total return terms, is not surprising. However, the gap from the top since November 2025 (somewhere mid-January 2026) is even higher - potentially ~6 percentage points. That could mean a little more than a more aggressive option layer alone accounting for LFGY's resilience. That needs to be investigated (in the subsequent section) to see whether some structural factors are at play that demand a switch in ratings. The other factor that is not surprising, but is even more "better than expected" is how both BLOX and LFGY have been resilient compared to Bitcoin's own ~23% decline since November. What is not surprising is that covered call strategies have shown resilience - that is implied because there is premium to be harvested, potentially even more than usual when markets are volatile and premiums shoot up. What needs a deeper dive is whether this effect is fully attributable to the option strategy, or whether there are equally important factors at the portfolio level at play, that income investors should keep in mind for the regime ahead (again discussed in the subsequent section). Overall, the performance in both BLOX and LFGY is directionally expected, but there are some aspects that need to be analyzed that appear to be beyond simple option strategies alone. Implications From The Crypto-Adjacent Space To understand the underlying mechanics, excluding the option layer, I downloaded the full holdings for both BLOX and LFGY from their respective websites. Although categorization is based on my judgment and could be debated (e.g., Circle/CRCL treated as infrastructure, Block classified as non-crypto, miners grouped as high-beta), the directional analysis is still revealing. Holdings Analysis - LFGY and BLOX (LFGY and BLOX Websites, Author's bucket assumptions) Clearly, two critical areas of differentiation arise. BLOX is heavily exposed to direct crypto (including Ethereum). Which means in the recent past sharp corrections there should have been a greater hit to BLOX's total returns. Additionally, non-crypto exposure in companies like Nvidia, TSM, PayPal, etc., is also low in the case of BLOX, creating a higher correlation with crypto price regimes and much less diversification to fall back on. Thankfully, we did not see the non-crypto space take off while crypto was down, otherwise BLOX could have seen a greater drawdown relative to LFGY's underlying portfolio. In the light of BLOX's relative disadvantage when the core portfolio was under severe pressure, I think the underperformance by only 4 percentage points versus LFGY possibly indicated a stronger than expected option layer that has been actively handled to reduce the drag. That is especially more likely, looking at the 11 percentage point positive total return difference versus IBIT. So, the takeaway from what we have discussed thus far is this: BLOX is structurally more exposed to crypto prices, but potentially has a stronger than expected option layer (could be strike selection or active rolling of options, not necessarily heavier coverage, which we found lacking in our earlier thesis). All in all, BLOX's performance in unfavorable territory is better than expected - shows resilience. LFGY is expected to do well anyway because the option layer is more aggressive (as discussed in the November thesis) and the portfolio is less crypto-exposed. Another theme that emerges from the analysis is that the crypto adjacent space (payments and commerce platforms implementing crypto) remained resilient even as crypto corrected. The crypto sentiment affects adoption and earnings there but crypto crash does not translate as much to a crash in the adjacent space. That should continue happening. Which means both LFGY and BLOX investors will be relatively insulated from a further crash in crypto prices. But whenever crypto rebounds, you will see BLOX surge ahead due to its greater correlation in the underlying portfolio. And we have seen when BLOX rallies, the upside differential is far higher than the 4 percentage differential we have seen in uncomfortable territory for BLOX. BLOX has actually done well in this regime and appears to be well positioned to retain the Buy rating issued in November. Especially given my crypto outlook ahead. Since both the LFGY and BLOX portfolios are Bitcoin heavy (with low Ethereum exposure), I will talk in Bitcoin terms, although the sentiment may be applicable to the entire crypto space. The magnitude of correction seen in the Bitcoin space - almost 40% down from the 2025 peaks - reduces the odds of a further crash compared to where we were in November last year. That does not mean, further material corrections are ruled out, though. More importantly, I have structural reasons to hold to a bullish Bitcoin thesis in the long term, as I outlined in another thesis I wrote on covered call Bitcoin plays - The case for a Bitcoin rebound is also stronger today because ETF inflows continue to show strong interest despite the sharp pullback. Spot Bitcoin ETF assets have declined from roughly $170b at the peak to about $84b currently - primarily because of the price correction but also due to several months of net outflows. However, cumulative net inflows have only reduced from around $63b to $54b, indicating that most of the selling has come from more recent, momentum-driven allocations rather than a reset in interest levels. This is especially important because the tug of war between equities, crypto and gold has been going through volatile swings with every macro and geopolitical development. As long as inflows do not show a panic drop in interests, I don't see a reason to discard the long term bullish thesis on increasing adoption and supportive legislations. That view remains, and without a long-term bullish view, neither LFGY nor BLOX will do well. They may mitigate drawdowns, but total returns will suffer on an absolute basis. What Income Investors Should Do BLOX will likely continue to underperform LFGY if crypto corrections continue, but it will hold up better than expected, as we have seen so far. Importantly, any Bitcoin crash from here will not transmit linearly to the portfolio, even discounting the options layer that could cushion losses. And the risk-reward asymmetry is still overwhelmingly in favor of BLOX. We have seen BLOX underperform by only 4 percentage points when LFGY is down by over 7%. For context, a similar upside in LFGY's total returns, has meant ~30% total returns in BLOX. That is because BLOX's option layer is less aggressive, as we have discussed in my November thesis, plus its underlying portfolio amplifies the crypto bull run, as discussed earlier in the current thesis. Data by YCharts That asymmetry shows how well BLOX's defense is working despite conditions that do not favor its setup. And that is also the reason why BLOX retains the Buy rating (while LFGY is a Hold). For income focused investors, I recommend further accumulation of BLOX despite its recent underperformance. Covered call income investors have already seen how well these strategies work compared to direct Bitcoin exposure (or even covered call strategies on pure Bitcoin underlying). The other trade-off income investors will have to make when preferring BLOX over LFGY is the yield differences. The yield on a cost basis for LFGY is a staggering ~60% for investments made 6 months ago compared to a less aggressive income strategy like BLOX (which shows a 6-month yield of ~24% on a cost basis). Both strategies are NAV-erosive in nature, and even BLOX has aggressive yields on an absolute basis. So, we are not really choosing a lower-income product over a better total return product. The relative yield case is poorer in BLOX, yes, but on an absolute basis it is still classified as a very high income tool. Enough to imply that its superior total returns in the expected regime ahead and in the long term cannot be overlooked. Yield on Cost - LFGY vs BLOX (Seeking Alpha)
27 Mar 2026, 13:10
Binance Australia’s Missteps Spark Major Regulatory Action And Raise Industry Concerns

Binance Australia Derivatives received a substantial penalty after client misclassification issues emerged. ASIC’s court action highlighted weaknesses in onboarding, staff oversight, and regulatory safeguards. Continue Reading: Binance Australia’s Missteps Spark Major Regulatory Action And Raise Industry Concerns The post Binance Australia’s Missteps Spark Major Regulatory Action And Raise Industry Concerns appeared first on COINTURK NEWS .
27 Mar 2026, 13:10
CoinDesk 20 performance update: AAVE drops 3.2% as nearly all constituents decline
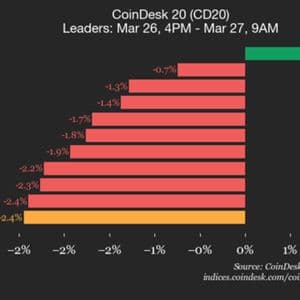
Bitcoin Cash (BCH), up 0.8% from Thursday, was the only gainer.


