


News
25 Mar 2026, 13:33
Ripple Price Analysis: XRP Struggles Against USD, Even Weaker vs BTC
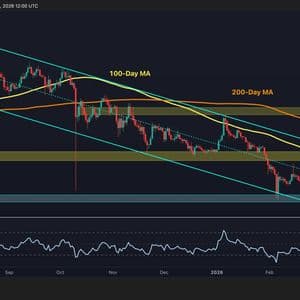
XRP is trading around $1.43, still deep in a correction that has erased the majority of its bull market gains. With both moving averages trending downward and the price trapped inside a descending channel, the altcoin continues to underperform against broader market expectations as Q1 2026 draws to a close. Ripple Price Analysis: The USDT Pair Despite bouncing from the February low near $1.20, XRP has struggled to build any meaningful momentum on the USDT pair. The recovery has been gradual and unconvincing, with the price failing to clear even the first layer of resistance at $1.80. This level is the higher boundary of the channel and a key supply zone that has been reinforced multiple times over the last couple of months. Both the 100-day MA (~$1.60) and 200-day MA (~$2.10) remain well above the current price and are still declining, leaving XRP with a stack of overhead resistance before any bullish case can be made. The RSI has also recovered from oversold territory and is hovering around 50, which reflects neutral momentum at best. A sustained close above the $1.80 level is the minimum requirement to shift the short-term outlook, while a breakdown below the $1.20 zone reopens the path toward the key psychological level at $1.00. The BTC Pair The picture against Bitcoin is arguably worse. XRP/BTC has slipped to 1,994 sats, now testing below the 2,000 sats support level that had held on a closing basis through most of the correction. That subtle but significant breach suggests XRP is continuing to lose ground relative to Bitcoin, with the 100-day (2,200 sats) and 200-day (2,100 sats) moving averages both overhead and converging downward. The broader descending channel structure has been in place since the July 2025 peak near 3,000 sats, and there is no technical sign of a reversal on this pair yet. The RSI has also dropped back below 50, pointing to a potential bearish shift in the short-term, following the rejection from the 100-day moving average. As a result, unless XRP/BTC reclaims the 2,000 sats level convincingly and breaks above the channel’s upper boundary, the ratio looks more likely to drift toward the lower boundary of the channel near 1,600 sats, or even lower in the coming months. The post Ripple Price Analysis: XRP Struggles Against USD, Even Weaker vs BTC appeared first on CryptoPotato .
25 Mar 2026, 13:31
Expert Says XRP Is About to Explode into Life-Changing Generational Wealth

Crypto commentator Archie (@Archie_XRPL) highlighted significant XRP activity this week, noting that recent market behavior could indicate either a full reversal or confirmation of a bottoming structure. His analysis, accompanied by a weekly chart, signals that XRP is approaching a critical point that could bring generational wealth. Technical Signals on the Weekly Chart The weekly chart shows three notable zones of strong price acceleration. The first occurred in late 2020 and early 2021, when XRP surged from under $0.3 to a peak of $1.96 in April of that year. The second climb occurred in 2024, when XRP rose 500% from around $0.5 to over $3.3. Currently, the chart highlights a third zone at $1.30 to $1.40, suggesting a potential breakout area. This level has repeatedly acted as support, reinforcing its significance in determining the next major price rally. Price consolidation at this level indicates accumulation and a potential for increased volatility once momentum resumes. This upcoming rally is the third highlighted zone on the chart. Archie observed, “Either we start to fully reverse here, or confirm a textbook bottoming structure.” This statement suggests that XRP is positioned at a critical juncture where both bullish and stable accumulation outcomes favor long-term holders. XRP ARMY: PREDICTION FOR THIS WEEK MONSTROUS REVERSAL LOADING Let’s end march with a bang! 1⃣Clarity Act advances: Senate Banking markup push? House vote momentum if fast-tracked this week the floodgates open! 2⃣SEC ETF rule deadline this Friday: Clarity on new XRP… pic.twitter.com/PJgruCQPAs — Archie (@Archie_XRPL) March 23, 2026 Market Developments Supporting Momentum Several market catalysts are contributing to the potential for a strong move. The CLARITY Act’s progression could accelerate adoption by offering clearer regulatory guidelines. Archie pointed to the Senate Banking markup and potential House vote as triggers for renewed institutional participation. Additionally, the SEC ETF rule deadline this Friday may allow new XRP products to enter the market, providing further liquidity and momentum. The rule requires the SEC to approve or deny pending cryptocurrency ETF applications, and meeting this deadline could bring regulatory clarity, attract institutional investors, and strengthen XRP adoption and price potential. Geopolitical conditions also play a role. The market uncertainty recently triggered by the war in Iran pushed XRP’s price down . However, Archie mentioned that tensions in the Middle East are beginning to stabilize, which can reduce macroeconomic uncertainty and allow investors to focus on market opportunities. These combined factors suggest an environment conducive to a sustained price movement for XRP. We are on X, follow us to connect with us :- @TimesTabloid1 — TimesTabloid (@TimesTabloid1) June 15, 2025 What’s Next for XRP? XRP is entering a decisive week. Regulatory progress, ETF developments, and stabilizing geopolitical factors all support potential upward movement. According to Archie, “When this chart goes, it’s going to EXPLODE into life-changing generational wealth territory.” He sees the current price level as a rare opportunity, with the cryptocurrency demonstrating conditions similar to previous explosive phases. Disclaimer : This content is meant to inform and should not be considered financial advice. The views expressed in this article may include the author’s personal opinions and do not represent Times Tabloid’s opinion. Readers are advised to conduct thorough research before making any investment decisions. Any action taken by the reader is strictly at their own risk. Times Tabloid is not responsible for any financial losses. Follow us on X , Facebook , Telegram , and Google News The post Expert Says XRP Is About to Explode into Life-Changing Generational Wealth appeared first on Times Tabloid .
25 Mar 2026, 13:27
Binance’s Grip on Crypto Loosens as Market Crash Rattles Faith
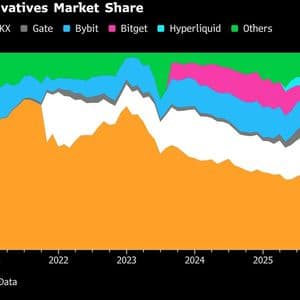
Binance Holdings Ltd. once controlled crypto trading to a degree that would be unthinkable in traditional markets.
25 Mar 2026, 13:25
CoinDesk 20 performance update: Stellar (XLM) gains 6% as all constituents rise
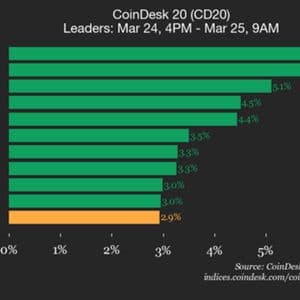
Aave (AAVE), up 5.8% from Tuesday, joined Stellar (XLM) as a top performer.
25 Mar 2026, 13:24
Bitcoin rebounds during Iran war, but safe haven role unproven

Bitcoin is beating gold during the Iran war, but its dependence on liquidity cycles keeps the safe haven narrative in question.
25 Mar 2026, 13:22
Trump’s Iran Pause Triggers Bitcoin Rally as Geopolitical Risk Reprices Markets

Bitcoin has spent this week staging a convincing defence of the $67,035 monthly open and, as of Wednesday, is pressing against the lower boundary of the $72,000–$82,000 air gap again. This is the zone of thin historical accumulation our analysts have identified as the most probable expansion target if sustained demand returned. The catalyst is geopolitical rather than macro. And the mechanism by which it operates reveals something important about how markets actually process conflict risk. On Monday, President Trump announced a five-day postponement of planned strikes on Iranian power plants. Trump also underscored “very good and productive” conversations towards a “complete and total resolution.” Bitcoin surged 4.8 percent to an intraday high of $71,811, oil futures collapsed nearly ten percent, and Brent retreated from $112 towards $102, while the S&P 500 rose 3.8 percent. In relative terms, the S&P 500’s move was considerably stronger than bitcoin’s, reflecting how far equities had already weakened before bitcoin bottomed first, consistent with our earlier thesis on relative strength. On Tuesday, Iranian state media denied that any negotiations had taken place. Bitcoin barely flinched initially, holding above $71,000 before retracing to test sub-$70,000 demand levels once more, then resolving higher. The core analytical conclusion is clear: the United States holds the decisive military escalation lever in this conflict. When the entity possessing the most potent destructive capacity signals a voluntary pause, markets instantly reprice the probability of resolution. This occurs regardless of whether Tehran officially validates the talks. Iran’s subsequent denial, while geopolitically relevant, remains market-irrelevant as long as the US maintains its de-escalatory posture. Trump administration’s capacity to de-escalate without requiring Tehran’s cooperation, by simply refraining from escalation, creates a pricing asymmetry the market is currently acting on. The exchange-traded fund (ETF) flow data illuminates this dynamic sharply. On Monday, 23 March, the day of the US restraint announcement, net inflows reached $167.2 million. The move was driven predominantly by IBIT, which absorbed $160.8 million, marking its strongest single-day inflow since 17 March and halting a three-day post-Federal Open Market Committee (FOMC) outflow streak. That momentum partially reversed on Tuesday, 24 March, with $66.6 million in net outflows coinciding with Iran’s denial. Even so, the week-to-date net position remains positive at $100.6 million. These flows make one thing plain: ETF allocators aren’t running complex macro models. They’re reacting with immediate precision to the geopolitical news flow from the Iran theatre. The structural question this raises for the air gap is the same one identified last week: follow-through demand. As established via the Unspent Transaction Output (UTXO) Realised Price Distribution, the $72,000–$82,000 band carries thin historical cost-basis accumulation. Limited supply was transacted there, meaning limited technical resistance if acceptance is achieved. The pre-condition for that acceptance hasn’t changed: sustained ETF inflows and continued spot buying. What has changed is that the primary macro obstacle to those inflows, Brent above $112 and rate-hike pricing at 40 percent, has materially softened in 48 hours on a single geopolitical statement. Oil at $102 is a different environment to oil at $112. The rate-hike narrative doesn’t survive an energy reversal, and markets know it. Whether Monday’s IBIT-led recovery was a one-session relief trade or the opening of a renewed accumulation regime will be visible in the next two to three days of flow data. If inflows sustain above $100 million per day through the end of the week, consistent with the pre-FOMC pattern, the demand pre-condition for air gap acceptance will have been re-established. If Tuesday’s partial reversal deepens, the market will have confirmed its treating Trump’s pause as a temporary signal rather than a durable shift, and bitcoin reverts to the prior consolidation range, with $67,035 as the live floor. Takeaway The $72,000–$82,000 air gap is structurally intact and now directly in play, with acceptance above the bottom band confirmed. Trump’s de-escalation signal repriced the probability distribution faster than any macro data could. ETF flows confirm institutional allocators are reading the geopolitical tape same-day. The bull trigger identified last week, Iran de-escalation leading to oil below $100 and a rate-hike reversal, has begun activating. Whether it sustains is a function of the next 48–72 hours of flow data. The post Trump’s Iran Pause Triggers Bitcoin Rally as Geopolitical Risk Reprices Markets appeared first on Bitfinex blog .


