


News
10 Jun 2026, 05:26
Kalshi Perps Hit $1B in Days, ProShares Plans 2x SpaceX ETF, Fable 5 Rattles DeFi
Crypto News Kalshi's perpetual futures crossed $1 billion in cumulative trading volume in under a week, a pace that dwarfs the firm's original prediction-market business. The company's Bitcoin perp...
10 Jun 2026, 05:25
BTC/USDT Spot CVD Chart Analysis: Volume Heatmap and Order Flow Insights as of 6:00 a.m. UTC

BitcoinWorld BTC/USDT Spot CVD Chart Analysis: Volume Heatmap and Order Flow Insights as of 6:00 a.m. UTC As of 6:00 a.m. UTC, the BTC/USDT spot Cumulative Volume Delta (CVD) chart provides a detailed look into the current order book dynamics for Bitcoin. This analysis tool, widely used by active traders, breaks down trading activity into two key visual components: a volume heatmap and a cumulative delta line graph. Understanding the Volume Heatmap The top section of the chart features a Volume Heatmap, which tracks the concentration of trading volume at specific price levels. When the price lingers in a particular range or makes a significant move, the background color on the heatmap brightens. These brighter areas are often interpreted by traders as potential zones of support or resistance, as they represent price levels where a high volume of transactions has occurred. This can help identify where the market might react if revisited. Decoding the Cumulative Volume Delta (CVD) The lower section of the chart displays the Cumulative Volume Delta (CVD) indicator. This metric categorizes buy and sell orders by trade size and tracks their cumulative impact over time. As the volume of buy orders increases, the corresponding colored line on the chart rises. The chart distinguishes between different order sizes. The yellow line tracks orders ranging from $100 to $1,000, representing retail and smaller-scale trading activity. In contrast, the brown line tracks large orders between $1 million and $10 million, which are typically associated with institutional investors or high-net-worth traders. Monitoring the divergence or convergence of these lines can offer insights into whether retail or institutional sentiment is driving the current price action. What This Means for Traders For traders monitoring the BTC/USDT pair, this CVD chart offers a real-time snapshot of order flow and market microstructure. By observing which colored line is rising more steeply, one can gauge the relative strength of buying or selling pressure from different market participants. A sharp rise in the brown (institutional) line, for instance, may signal significant large-player interest at current levels, while a sustained increase in the yellow (retail) line might indicate broader market participation. Conclusion The BTC/USDT Spot CVD chart as of 6:00 a.m. UTC provides a nuanced view of the order book, blending volume concentration data with categorized order flow. For traders focused on short-term price movements and market depth, this chart remains a valuable tool for understanding the forces at play behind Bitcoin’s price action. FAQs Q1: What does the Cumulative Volume Delta (CVD) measure? A1: The CVD measures the cumulative difference between buying and selling volume over time, categorized by trade size. A rising line indicates net buying pressure, while a falling line suggests net selling pressure. Q2: How is the volume heatmap on the chart created? A2: The heatmap is generated by tracking the amount of trading volume at each price level over a given period. Price levels with higher trading activity appear brighter on the chart, highlighting areas of potential support or resistance. Q3: Why are the yellow and brown lines significant? A3: The yellow line tracks smaller retail trades ($100–$1,000), while the brown line tracks large institutional trades ($1M–$10M). Comparing their movements helps traders understand whether retail or institutional investors are driving market trends. This post BTC/USDT Spot CVD Chart Analysis: Volume Heatmap and Order Flow Insights as of 6:00 a.m. UTC first appeared on BitcoinWorld .
10 Jun 2026, 05:24
XRP drops 4.5% as heavy selling breaks another support level
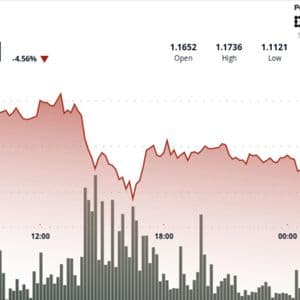
XRP lost the $1.13 area on elevated volume, leaving traders focused on whether the latest selloff marks a final washout or the start of a deeper move toward $1.00.
10 Jun 2026, 05:22
Bitcoin and gold fall together as a rate-hike bet hits every hedge

The relief rally that lifted crypto off last week's lows is unwinding alongside tech stocks and gold, with traders bracing for a US inflation print and a Warsh Fed that may stay hawkish.
10 Jun 2026, 05:17
XRP Slips Below $1.18 to $1.10 Decision Zone as Ripple Backs Water.org With RLUSD
XRP News XRP entered a fresh corrective leg after failing to sustain trade above the $1.18 region, sliding alongside broader weakness in Bitcoin and Ethereum across the altcoin market. The decline ...
10 Jun 2026, 05:14
Bitcoin Slides to $61K as ETF Outflows Hit $2.97B, $235B in Value Wiped
Bitcoin News US spot Bitcoin exchange-traded funds have endured their longest redemption streak on record, with cumulative net outflows reaching roughly $2.97 billion through the end


