


News
10 Jun 2026, 05:13
Bitcoin ETFs are no bigger today than when Trump won the election
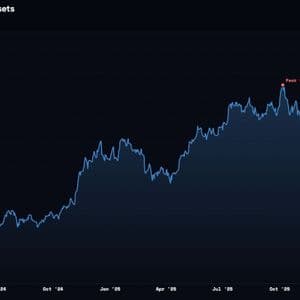
Net assets of U.S.-listed spot ETFs have fallen to levels last seen just after Trump won the election in early November 2024.
10 Jun 2026, 05:10
Bitcoin Holds $62K as ETF Outflows Reach $2.97B, Strategy Sells First BTC Since 2022
Bitcoin News Bitcoin clawed back into a $62,000 to $63,000 band this week after briefly puncturing the $60,000 threshold, a level that had acted as a psychological floor through the recent selloff....
10 Jun 2026, 05:06
Bitcoin Steadies Near $62K as Metaplanet Eyes Buyback, ETF Outflows Hit $2.97B
Bitcoin News Bitcoin slipped below the $60,000 mark before steadying in a $62,000 to $63,000 band, as broad selling pressure gripped the digital asset market. Technical readings flagged oversold co...
10 Jun 2026, 05:05
Gold Plummets Below $4,200 as US-Iran Tensions Fuel Hawkish Rate Bets Ahead of US CPI

BitcoinWorld Gold Plummets Below $4,200 as US-Iran Tensions Fuel Hawkish Rate Bets Ahead of US CPI Gold prices fell sharply below the $4,200 mark in early trading on Wednesday, driven by escalating US-Iran geopolitical tensions that have reinforced expectations of a more aggressive Federal Reserve stance. The decline comes just hours before the release of the US Consumer Price Index (CPI) report, a key data point that could further shape monetary policy direction. Geopolitical Jitters and Rate Expectations Collide The latest slide in gold reflects a dual shock to safe-haven demand. While geopolitical unrest typically boosts gold’s appeal, the specific nature of US-Iran tensions has instead spurred a flight into the US dollar and Treasury yields, pressuring the non-yielding metal. Traders are now pricing in a higher probability of a hawkish Fed response to any inflationary pressures stemming from potential supply disruptions, which in turn lifts real yields and weighs on gold. CPI Data Looms as the Next Catalyst Market focus is squarely on the upcoming US CPI report, due later today. A hotter-than-expected reading could solidify expectations that the Fed will maintain or even raise interest rates, a scenario that historically pressures gold prices. Analysts caution that gold may test further support levels if inflation data confirms persistent price pressures, especially as the dollar index strengthens. Conversely, a softer CPI could provide temporary relief, but the overarching geopolitical risk premium remains in play. What This Means for Investors For investors, the current environment presents a complex picture. Gold’s traditional role as a hedge against uncertainty is being challenged by the simultaneous rise in real rates and the dollar. The break below $4,200 is a significant technical level, and sustained trading beneath it could signal a deeper correction. Portfolio diversification and close monitoring of both geopolitical developments and central bank signals are essential in the coming sessions. Conclusion The combination of US-Iran tensions and hawkish rate expectations has created a powerful headwind for gold, pushing prices below the psychologically important $4,200 threshold. All eyes are now on the US CPI release, which will likely determine the metal’s near-term trajectory. Investors should prepare for continued volatility as markets digest geopolitical risks alongside critical economic data. FAQs Q1: Why did gold fall despite US-Iran tensions? Typically, geopolitical tensions boost gold as a safe haven. However, in this case, the tensions are fueling expectations of a more aggressive Federal Reserve to combat potential inflation from supply disruptions, which strengthens the dollar and real yields, both negative for gold. Q2: How does the US CPI report affect gold prices? The CPI is a key inflation gauge. A higher-than-expected reading reinforces hawkish Fed policy expectations (higher interest rates), which is bearish for gold. A lower reading could ease those fears and provide some support for gold. Q3: What is the next key support level for gold? With gold breaking below $4,200, the next major support level is around $4,100, followed by the $4,000 psychological mark. A sustained break below these levels could signal a deeper correction. This post Gold Plummets Below $4,200 as US-Iran Tensions Fuel Hawkish Rate Bets Ahead of US CPI first appeared on BitcoinWorld .
10 Jun 2026, 05:00
Non-USD stablecoins hit $2B ATH – Why altcoins still look weak

Humanity Protocol crash reveals weak altcoin momentum, turning liquidity signals bearish.
10 Jun 2026, 05:00
XRP Leverage Flush Hits Bybit While Binance Holds The Line – Analyst Explains Rare Setup

XRP is struggling around $1.15 as fear and uncertainty define the current market environment, and holders search for evidence that the current level represents support rather than a temporary pause before further decline. The price is under pressure — and a CryptoQuant analyst has identified a derivatives reset that occurred during the latest sell-off that reveals a sharp divergence between two of the largest XRP trading venues in the world. Related Reading: Ethereum OG Nails The Crash: Sells $188M, Buys Back Lower The sell-off triggered a forced deleveraging event on Bybit that the data makes impossible to dismiss. XRP open interest on Bybit fell to approximately $181 million — its lowest level since February 13, when it stood near $180 million. The current reading represents a 36% decline from Bybit’s recent peak of $283 million on May 22. A third of the leveraged XRP positioning on one of the most active derivatives venues in the market was flushed out in a compressed timeframe — the behavioral signature of forced exits rather than voluntary position management. Binance tells a completely different story. XRP open interest on Binance remained near $246 million following the same price decline — only approximately 2.4% below its recent high of $252 million recorded on June 2. While Bybit was experiencing a 36% open interest contraction, Binance was holding its positioning almost entirely intact. Two major venues. The same asset. The same price decline. Completely opposite derivative responses. The divergence between them is the structural signal that the CryptoQuant analysis examines — and what it reveals about the health of the current XRP market structure at $1.15 is the most important analytical question the data is currently raising. The Next Move Comes From One Exchange The liquidation data confirms what the open interest divergence implied. XRP’s decline was not driven purely by spot selling — forced exits from leveraged long positions amplified and accelerated the move. Multiple liquidation events exceeded $3.5 million with long liquidations dominating throughout. The futures volume data adds the scale context. On June 5, Binance recorded approximately $1.85 billion in XRP futures volume. Bybit contributed $727 million, OKX $429 million, and Bitget $423 million — a combined $3.43 billion across four venues in a single session. The derivatives market was not disengaged during the decline. It was processing an enormous volume of forced and voluntary position changes simultaneously. XRP Futures Trading Volume By Exchange | Source: CryptoQuant The recovery from the $1.055 low back above $1.14 — a rebound exceeding 8% — provides evidence that the sell-off contained a leverage flush component rather than representing a complete breakdown in underlying demand. When forced liquidations drive a significant portion of the decline, the price tends to recover once exits are complete and genuine buyers emerge. The structure that remains is specific. Bybit has deleveraged sharply with open interest reset to February levels — fragile positioning cleared. Binance remains near its recent highs with positioning almost entirely intact. The next major XRP derivatives development will originate from Binance — the venue carrying the most residual exposure and the exchange that has not yet experienced the reset Bybit completed during the sell-off. Related Reading: XRP Just Printed A Rare Binance Signal As Market Volatility Accelerates XRP Clings To $1.15 After Losing Key Support XRP is trading around $1.15 after a prolonged decline that has erased much of the advance generated during the second half of 2025. The chart shows a market that remains under pressure, but one that is also approaching a critical inflection point after testing its lowest levels of the year. XRP consolidates below $1.15 level | Source: XRPUSDT chart on TradingView The dominant feature on the 3-day timeframe is the persistent sequence of lower highs and lower lows that began after XRP peaked near $3.50. Every major recovery attempt since then has been rejected beneath the previous swing high, confirming that sellers remain in control of the broader trend. More recently, XRP lost the important $1.25-$1.30 support area, triggering another leg lower toward the psychological $1.10 region. Related Reading: Why Did Bitcoin Crash? On-Chain Data Points To One Missing Ingredient From a structural perspective, the current price zone is significant because it sits near the lows established during the first quarter correction. Buyers have repeatedly defended this area, preventing a complete breakdown despite multiple tests. However, the rebound attempts have been weak, indicating that demand remains limited. The moving averages continue to reflect bearish conditions. XRP is trading below the 50-period, 100-period, and 200-period moving averages, while the 50-period average is acting as dynamic resistance near $1.40. Until price reclaims that level, any bounce remains technically corrective rather than trend-changing. The key support remains between $1.05 and $1.10. A decisive loss of that zone could expose XRP to a deeper retracement toward the $0.90-$1.00 region. Conversely, reclaiming $1.30 and then $1.40 would be the first signal that buyers are beginning to regain control after months of sustained weakness. Featured image from ChatGPT, chart from TradingView.com


