


News
9 Jun 2026, 23:04
Privacy Coins Rebound 4.5% as Yen Shorts Hit $11B and DeFi Exploits Reach $36.7M
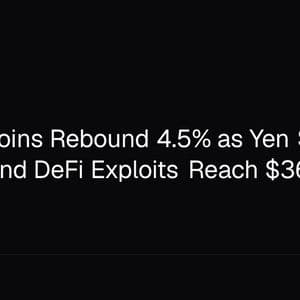
Crypto News Privacy altcoins rebounded 4.5% on Monday, led by Zcash and Monero, even as the category remains down roughly 12% over the past month. Zcash climbed about 7% on the day while Monero adv...
9 Jun 2026, 23:04
XRP Sees Intense Capitulation As Realized Profit-To-Loss Ratio Plunges

As the XRP price attempts to rebound from its recent lows, Glassnode has shared key on-chain metrics pointing to weakening momentum and “intense capitulation.” Related Reading: Bitmine Makes Largest Ethereum Purchase Of 2026 As Tom Lee Dismisses Market Selloff XRP Profit/Loss Ratio Falls To Lowest Levels Since 2024 On Tuesday, market intelligence platform Glassnode revealed that XRP is flashing warning signals, with key on-chain indicators pointing to widespread capitulation and decreasing network activity. In an X post, Glassnode researchers highlighted that the 90-day moving average (MA) of the altcoin’s Realized Profit-to-Loss Ratio has fallen to an area historically associated with deeper downtrends and periods of market capitulation. Notably, the key metric has dropped to 0.38, its lowest level since 2024, meaning that for every dollar of losses realized in the market, only 38 cents in profit are being taken. This marks a significant reversal from the 2025 peak, when the ratio surged to 50, indicating profit-takers outpaced loss-sellers by a factor of 50. That dynamic has now fully inverted, Glassnode affirmed, adding that a ratio this low suggests that most participants moving XRP are exiting their positions at a loss, which is “a hallmark of intense capitulation.” In addition, the blockchain analytics firm pointed out that network activity has declined significantly. According to the data, the 90-day average of total transaction fees paid on the XRP network has fallen from 5,900 XRP in February 2025 to just 500 XRP, representing a 91.5% drop. “A drop of this magnitude is not a fee market adjustment. It reflects a near-total contraction in organic transaction demand on the network since the speculative peak,” Glassnode affirmed. The drop in these indicators suggests investor confidence has weakened, and the market has shifted to reduced speculative appetite with subdued participation. Is XRP’s Bottom Near? Over the past two weeks, XRP’s price has retraced nearly 15%, falling to its lowest levels since November 2024. Amid this performance, analyst ChartNerd noted that the cryptocurrency’s bear markets have historically lasted 400-790 days with 85-96% drops. Currently, the altcoin has only corrected for approximately 350 days, with a 71% retracement from the July highs. However, “the duration and % depth of these bears are diminishing over time; therefore, the territory for marking a historical bottom between now and EOY is fast approaching,” he stated. He also observed that the altcoin closed below its 200-week Simple Moving Average (SMA) last week, which could also signal that the bottom may be on the horizon. As he explained, during prior cycles, a structural bottom formed between 8 and 29 weeks after the first weekly close below this SMA, suggesting that XRP could begin forming its bottom in the coming months, if history repeats. Meanwhile, market watcher Ali Martinez noted that XRP could be mirroring the same pattern it has repeated since 2018, as it may be approaching its largest buying zone in the last eight years. Related Reading: Bitcoin’s Rise May Have Little To Do With The Latest Purchase News “For nearly a decade, every touch of this rising trendline has marked a major turning point, sending XRP back toward the $3 resistance,” the analyst stated, adding that the cryptocurrency is currently approaching this trendline again, with support sitting between the $0.70 and $0.90 levels. If this zone holds, a rally back to $3 becomes “a realistic scenario.” Moreover, if XRP finally breaks above the eight-year resistance, around $3.30, the next macro target may be between $8 and $13, the analyst concluded. Featured Image from Unsplash.com, Chart from TradingView.com
9 Jun 2026, 23:02
The CLARITY bill stirs debate in the Senate! Why are crypto developers closely watching?

🚨 Debate over developer protections heats up as the CLARITY bill advances in the US Senate. 💡 More than 60 crypto company leaders including Solana's CEO urge lawmakers to protect open source developers in $SOL. 📢 SEC’s Hester Peirce says publishing blockchain code is protected free speech, not financial activity. Continue Reading: The CLARITY bill stirs debate in the Senate! Why are crypto developers closely watching? The post The CLARITY bill stirs debate in the Senate! Why are crypto developers closely watching? appeared first on COINTURK NEWS .
9 Jun 2026, 23:00
Metaplanet CEO eyes share buybacks to boost Bitcoin yield – ‘Our primary KPI’

Instead of purchasing more Bitcoin, can a treasury company increase its value by repurchasing its shares?
9 Jun 2026, 22:54
Metamask Launches Agent Wallet for AI-Driven DeFi Trading, Targets $236B AI Agent Market

Metamask has launched Agent Wallet, a self-custodial wallet that lets AI agents trade across DeFi while keeping users in control. The product adds mandatory transaction checks, user-set limits, and protection for eligible transactions. Metamask Covers Eligible Agent Wallet Transactions Up to $10,000 Metamask is moving into AI-driven finance with the launch of Metamask Agent Wallet,
9 Jun 2026, 22:42
Ripple’s RLUSD backs Water.org aid for 2 billion worldwide

🚨 2 billion people lack safe water at home, and $XRP powers a new response. 🌍 Ripple joins Water.org, Amazon, and Gap in the Get Blue campaign. 💧 RLUSD stablecoin enables cross-border support for water projects. Continue Reading: Ripple’s RLUSD backs Water.org aid for 2 billion worldwide The post Ripple’s RLUSD backs Water.org aid for 2 billion worldwide appeared first on COINTURK NEWS .


