


News
17 Apr 2026, 04:33
Solana price at risk as key network metrics drops, ETF inflows slow

Solana price has moved sideways in the past few months as activity in the network slowed and the crypto winter continued. SOL token has remained inside the narrow range between $75 and $93 since the first week of February this year. It is stuck in a deep bear market after falling from last year's high of $300. Solana ETT experience modest inflows American investors are continuing their Solana ETF accumulation this month. Data compiled by SoSoValue shows that these funds are in their seventh consecutive month in the green, with the cumulative total inflows rising to nearly $1 billion. Solana ETFs have added $17.9 million in assets this month, its lowest level since their inception. They may, however, cross last month’s $45 million if the inflows trajectory continues. Bitwise, a top crypto asset manager, is the biggest Solana ETF with over $634 million in assets under management (AUM). It is followed by other funds by companies like Grayscale, Fidelity, and VanEck. In addition to the weaker ETF inflows trajectory, data shows that Solana's futures open interest has remained under pressure in the past few months. It stood at $5.46 billion, down sharply from last year's high of $16 billion. Futures open interest is a metric that looks at the outstanding call and put options. A higher number is usually highly bullish as it shows that there is robust liquidity in the market. Solana, like other cryptocurrencies, has experienced weak activity in the perpetual futures market after the large crash that triggered $20 billion in liquidations on October 10 last year. Solana ecosystem growth has stalled More data shows that Solana's ecosystem growth has come under pressure in the past few months. For example, while the amount of stablecoins in the network has jumped to $16 billion and the number of addresses moved to 5.3 million, the volume and number of transactions have dropped slightly. Solana processed stablecoins worth over $556 billion in the last 30 days as the number of stablecoin transactions fell to 279 million. More data compiled by Nansen shows that Solana’s total transaction and fees collected have pulled back in the last 30 days. Solana handled over 2.3 billion transactions, down by 10%, while the number of active addresses fell by 12% to 94 million. The network fees dropped by 22% to $15.9 million. This performance is mostly because of the ongoing crypto winter and the strong growth of Hyperliquid, which has taken some market share from Solana's dApps. Hyperliquid is now handling more transactions than all Solana platforms combined. Solana price prediction: Technical analysis SOL price chart | Source: TradingView The daily timeframe chart shows that the SOL price has remained in a narrow range in the past two months. It has been confined between the support and resistance levels at $75 and $93. This consolidation has led to a big drop in the Average True Range (ATR) and the narrowing of the spread between the three lines of the Bollinger Bands. Meanwhile, the Relative Strength Index (RSI) and the Percentage Price Oscillator (PPO) have continued rising, a sign of a bullish divergence pattern. Therefore, it is a tough call to make right now as this channel may be part of a bearish flag pattern, which often leads to a strong bearish breakdown. On the other hand, the ETF inflows mean that an accumulation is continuing, which may lead to a strong rebound. As such, the next price action will depend on whether the coin rises above the upper side or drops below the lower side. A bearish breakout may see if drop to $50, while a rebound may take it to $100 and above. The post Solana price at risk as key network metrics drops, ETF inflows slow appeared first on Invezz
17 Apr 2026, 04:32
Bitcoin sees 3.5 percent weekly jump as funding turns negative

📈 Bitcoin ended the week up 3.5% at $74,700. Ethereum led major coins with a 6% weekly gain. 🚨 Critical data: Bitcoin funding rates turned sharply negative. Continue Reading: Bitcoin sees 3.5 percent weekly jump as funding turns negative The post Bitcoin sees 3.5 percent weekly jump as funding turns negative appeared first on COINTURK NEWS .
17 Apr 2026, 04:30
Indonesian Rupiah Plummets to Historic Low vs USD as Middle East Fears Intensify

BitcoinWorld Indonesian Rupiah Plummets to Historic Low vs USD as Middle East Fears Intensify JAKARTA, Indonesia – April 2025: The Indonesian Rupiah has plunged to an unprecedented record low against the US Dollar, with the USD/IDR pair approaching the critical 17,200 level. This historic depreciation stems primarily from escalating geopolitical tensions in the Middle East, which are driving investors toward traditional safe-haven assets. Consequently, emerging market currencies like the Rupiah face intense selling pressure. Indonesian Rupiah Hits Record Low Amid Global Uncertainty Market data confirms the Rupiah’s dramatic fall. The currency breached the psychologically significant 17,000 level earlier this week. It now trades perilously close to 17,200. This represents the weakest point in Indonesia’s modern financial history. Analysts immediately linked the sell-off to renewed conflict in the Middle East. Regional instability typically triggers a flight to safety. Investors consequently dump riskier assets from emerging economies. They then flock to the US Dollar, US Treasuries, and gold. Furthermore, domestic economic factors compound the external pressure. Indonesia’s trade balance showed a surprising deficit last month. The country also faces inflationary pressures from elevated global energy prices. These combined forces create a perfect storm for the currency. Central bank officials are monitoring the situation with heightened alertness. They have already signaled readiness to intervene in forex markets. Geopolitical Risks from the Middle East Drive Market Volatility The immediate catalyst for this currency crisis is clear. Military escalations between major powers in the Persian Gulf region erupted over the weekend. Oil prices consequently surged by over 8%. Financial markets globally reacted with pronounced risk aversion. Emerging market equities and currencies experienced synchronized declines. The Indonesian Rupiah, however, emerged as one of the hardest-hit Asian currencies. This vulnerability stems from Indonesia’s specific economic profile. The nation remains a net importer of oil. Higher crude prices directly worsen its trade deficit. They also increase subsidy burdens on the state budget. Foreign investors hold significant amounts of Indonesian government bonds. These investors are now rapidly exiting their positions. They seek safer returns amid the global turmoil. The resulting capital outflows place immense downward pressure on the Rupiah. Expert Analysis on Central Bank Policy and Economic Impact Financial experts point to a challenging policy dilemma for Bank Indonesia. Dr. Ananda Kusuma, a senior economist at the Institute for Economic and Financial Research in Jakarta, provided context. “The central bank faces a trilemma,” Kusuma explained. “It must choose between stabilizing the exchange rate, maintaining independent monetary policy, and allowing free capital movement. Current conditions may force aggressive interest rate hikes. Such hikes could slow domestic economic growth.” Historical data supports this analysis. The table below shows key Rupiah crisis levels: Year USD/IDR Peak Primary Catalyst 1998 16,800 Asian Financial Crisis 2015 14,850 US Taper Tantrum 2020 16,575 COVID-19 Pandemic 2025 17,200* Middle East Conflict *Current level. The potential impact on everyday Indonesians is significant. A weaker Rupiah increases the cost of: Imported goods , including essential food items and medicines. Foreign debt repayments for both the government and corporations. Overseas travel and education for Indonesian families. Market Response and Future Trajectory for USD/IDR Forex traders are now watching several key indicators. First, they monitor statements from the Federal Reserve regarding US interest rates. Higher US rates typically strengthen the Dollar. Second, they analyze any diplomatic developments in the Middle East. A de-escalation could reverse the safe-haven flow. Third, they await concrete action from Bank Indonesia. Potential measures include: Direct intervention in the spot forex market using foreign reserves. Adjusting the benchmark 7-day reverse repo rate. Implementing stricter rules on foreign currency purchases. Meanwhile, the technical chart outlook appears bearish for the Rupiah. The USD/IDR pair has broken above all major moving averages. Momentum indicators show strong buying pressure for the Dollar. The next major resistance level sits near 17,500. Support, if any, may be found around the previous high of 16,800. Conclusion The Indonesian Rupiah has reached a record low against the US Dollar, driven by external geopolitical shocks and domestic economic vulnerabilities. The USD/IDR pair approaching 17,200 marks a critical moment for policymakers and markets. Bank Indonesia’s response in the coming days will be crucial for stabilizing the currency and mitigating broader economic impacts. The situation underscores the interconnected nature of global finance, where conflict in one region can swiftly trigger a currency crisis in another. FAQs Q1: Why is the Indonesian Rupiah falling so sharply? The primary driver is geopolitical risk in the Middle East, causing a global “flight to safety” where investors sell emerging market assets like the Rupiah and buy the US Dollar. Secondary factors include Indonesia’s trade deficit and inflationary pressures. Q2: What does USD/IDR approaching 17,200 mean for Indonesia’s economy? A weaker Rupiah increases the cost of imports and foreign debt repayment, potentially fueling inflation and straining government and corporate budgets. It can reduce purchasing power for ordinary citizens. Q3: What can Bank Indonesia do to stop the Rupiah’s decline? The central bank can intervene directly in foreign exchange markets by selling US Dollars from its reserves, raise interest rates to make Rupiah assets more attractive, or implement capital flow management measures. Q4: How does conflict in the Middle East affect Indonesia’s currency? Conflict drives up global oil prices. As a net oil importer, Indonesia faces a larger trade deficit when oil is expensive. This worsens its balance of payments and puts downward pressure on the Rupiah. It also triggers global risk aversion, leading to capital outflows. Q5: Has the Rupiah been this weak before? Yes, during the 1998 Asian Financial Crisis, the USD/IDR reached approximately 16,800. The current level near 17,200 is a new historic low for the currency pair. This post Indonesian Rupiah Plummets to Historic Low vs USD as Middle East Fears Intensify first appeared on BitcoinWorld .
17 Apr 2026, 04:25
Bitcoin Price Prediction: Analyst Warns $125K Target Looms from Impending Short Squeeze
BitcoinWorld Bitcoin Price Prediction: Analyst Warns $125K Target Looms from Impending Short Squeeze NEW YORK, March 2025 – A prominent cryptocurrency analyst projects Bitcoin could experience a dramatic price surge, potentially reaching $125,000 within weeks, driven by a specific and volatile market mechanism known as a short squeeze. This forecast, based on concrete derivatives market data, highlights a critical juncture for the world’s leading digital asset. Bitcoin Price Prediction Based on Derivatives Data Daniel Reis-Faria, CEO of Zerostack, recently presented a compelling case for a significant Bitcoin rally. He bases his analysis not on speculation but on a key metric from the cryptocurrency derivatives market: the BTC perpetual futures funding rate. According to data reported by CoinDesk, this rate has recently plunged to its most negative level since 2023. This technical indicator serves as a primary signal for Reis-Faria’s $125,000 Bitcoin price prediction. Essentially, the funding rate is a periodic payment exchanged between traders in perpetual futures contracts. A persistently negative rate, as currently observed, signals that a majority of leveraged traders are holding short positions, betting that Bitcoin’s price will decline. This creates a crowded trade scenario. Consequently, if the market moves against these traders, the resulting forced liquidations could fuel a powerful upward price spiral. Understanding the Mechanics of a Short Squeeze A short squeeze represents one of the most forceful dynamics in financial markets. It occurs when an asset’s price begins to rise, triggering losses for traders who have borrowed and sold it, expecting a decline. As the price climbs, these traders face margin calls, forcing them to buy back the asset to close their positions and limit losses. This wave of buying pressure then pushes the price even higher, creating a self-reinforcing cycle. In Bitcoin’s context, the leverage available on many cryptocurrency exchanges amplifies this effect. Traders using high leverage face liquidation much faster. The current market setup, with a deeply negative funding rate, suggests a substantial buildup of these vulnerable short positions. Therefore, even a moderate bullish catalyst could ignite the squeeze. Negative Funding Rate: Indicates a high concentration of short sellers paying long holders. Forced Liquidation: Automated closing of positions when traders’ collateral is depleted. Cascade Effect: Each liquidation creates more buy pressure, accelerating the rally. Historical Precedents and Market Context Short squeezes are not unprecedented in cryptocurrency markets. For instance, similar conditions contributed to rapid price ascents during previous Bitcoin cycles. The current macroeconomic backdrop also provides relevant context. With evolving regulatory clarity in major economies and continued institutional adoption, underlying demand for Bitcoin remains a significant factor. Furthermore, the Bitcoin network’s upcoming halving event, expected in April 2024, has historically been a focal point for market sentiment. While the halving directly affects miner issuance, it often catalyzes broader discussions about scarcity and value. Analysts frequently examine derivatives data alongside these fundamental events to gauge trader positioning and potential volatility. Analyzing the Risks and Counterarguments While the short squeeze thesis presents a clear bullish scenario, market participants must consider several risks. First, the prediction relies on Bitcoin’s price initiating an upward move to trigger the squeeze. External factors like negative regulatory news or broader macroeconomic downturns could instead sustain downward pressure, leading to the gradual unwinding of shorts without a dramatic squeeze. Second, sophisticated traders often monitor the same metrics. Some may preemptively close their short positions to avoid liquidation, potentially dampening the explosive effect. The market’s reaction function is not perfectly mechanical. Finally, liquidity depth on exchanges will influence the severity of the price move during a squeeze. Thinner order books can lead to more extreme price gaps and volatility. Key Metrics for a Potential Bitcoin Short Squeeze Metric Current Signal Implication Perpetual Funding Rate Deeply Negative High short interest, potential squeeze fuel Open Interest Elevated Large volume of leveraged positions at risk Liquidation Levels Clustered near current price Increases likelihood of cascade if price moves Expert Perspectives on Market Structure Reis-Faria’s analysis aligns with a school of thought that prioritizes derivatives market structure for predicting short-term volatility. Other analysts emphasize different indicators, such as on-chain data tracking whale movements or long-term holder behavior. The confluence of multiple bullish signals typically strengthens a price prediction. Market structure experts note that the proliferation of cryptocurrency derivatives products has fundamentally changed price discovery. The perpetual futures market, in particular, exerts a significant influence on spot prices. Monitoring the interplay between spot buying on exchanges like Coinbase and derivatives activity on platforms like Binance becomes crucial for a complete picture. Conclusion The prediction for Bitcoin to hit $125,000 hinges on a specific and observable market condition: a potential short squeeze fueled by extreme negative funding rates. While not a guarantee, this analysis provides a data-driven framework for understanding possible near-term volatility. Market participants should monitor derivatives metrics closely, as they offer critical insights into trader sentiment and potential flashpoints. Regardless of the immediate outcome, such analyses underscore the complex, interconnected nature of modern cryptocurrency markets, where derivatives activity can become a primary driver of spot price action. FAQs Q1: What is a Bitcoin short squeeze? A Bitcoin short squeeze is a rapid price increase caused when traders who have bet against Bitcoin (shorted it) are forced to buy it back to cover their losses as the price rises, creating additional buying pressure and pushing the price higher in a feedback loop. Q2: What does a negative perpetual futures funding rate mean? A negative funding rate means traders holding short positions are paying a fee to those holding long positions. It indicates that the market is heavily skewed towards short sellers, which can set the stage for a squeeze if the price starts to climb. Q3: How reliable are short squeeze predictions? While based on real-time data, short squeeze predictions are probabilistic, not certain. They identify a condition that *could* lead to a rapid price increase, but require a catalyst to begin and can be mitigated if traders exit positions preemptively. Q4: What is the difference between a short squeeze and a normal rally? A normal rally is driven by organic buying demand. A short squeeze is specifically amplified by the forced buying from leveraged traders being liquidated, which can cause sharper, more explosive price movements in a shorter timeframe. Q5: How can traders monitor the risk of a short squeeze? Traders can watch metrics like the aggregate funding rate across major exchanges, total open interest in futures, and estimated liquidation price levels, which are displayed on many cryptocurrency data analytics websites. This post Bitcoin Price Prediction: Analyst Warns $125K Target Looms from Impending Short Squeeze first appeared on BitcoinWorld .
17 Apr 2026, 04:10
Tokenize Private Credit Fund: Flow Capital’s Revolutionary $150M Blockchain Move
BitcoinWorld Tokenize Private Credit Fund: Flow Capital’s Revolutionary $150M Blockchain Move Hong Kong, March 2025 – Flow Capital, a prominent Hong Kong-based asset manager, announced today its groundbreaking plan to tokenize a $150 million private credit fund, marking a significant milestone in the convergence of traditional finance and blockchain technology. This strategic initiative, reported by Bloomberg, represents one of Asia’s largest tokenization projects for private credit assets and signals a transformative shift in how institutional investors access alternative investment opportunities. The firm will leverage Singapore’s regulated blockchain platform DigiFT to execute this ambitious digital transformation, creating a new paradigm for fund management and investor accessibility. Tokenize Private Credit Fund: A Strategic Financial Innovation Flow Capital’s decision to tokenize its private credit fund emerges from a calculated assessment of market trends and technological advancements. Private credit, traditionally characterized by illiquidity and high entry barriers, undergoes a fundamental transformation through blockchain tokenization. This process converts ownership rights in the $150 million fund into digital tokens on a blockchain, thereby enhancing transparency, reducing administrative costs, and potentially increasing liquidity for qualified investors. Consequently, the initiative addresses longstanding challenges in private market investing while opening new avenues for capital formation. Jacky Tian, Flow Capital’s Chief Investment Officer, articulated the firm’s vision during the announcement. “Our primary objective involves democratizing access to premium private credit opportunities,” Tian stated. “Furthermore, we aim to raise an additional $30 million through equity tokens by year-end, with an ultimate target of expanding the total fund size to $250 million.” This expansion strategy demonstrates confidence in both the underlying credit assets and the tokenization model’s market appeal. The equity tokens will represent direct ownership stakes in the fund’s management company, creating a dual-layer tokenization structure that distinguishes Flow Capital’s approach from simpler asset tokenization projects. Blockchain Infrastructure and Regulatory Framework Flow Capital selected DigiFT, a Singapore-based blockchain platform licensed by the Monetary Authority of Singapore (MAS), as its technological partner for this initiative. DigiFT specializes in the tokenization of real-world assets (RWAs) and operates within Singapore’s progressive regulatory sandbox for digital assets. The platform utilizes a permissioned blockchain architecture that balances transparency with necessary privacy controls for institutional participants. This partnership ensures regulatory compliance while leveraging proven blockchain infrastructure. The tokenization process involves several critical technical and legal components: Smart Contract Implementation: Automated compliance and distribution mechanisms Regulatory Alignment: Adherence to Hong Kong and Singapore securities regulations Custody Solutions: Institutional-grade digital asset custody partnerships Secondary Market Protocol: Framework for potential future token trading Hong Kong’s evolving regulatory landscape for virtual assets provides a supportive environment for this initiative. The Securities and Futures Commission (SFC) has established clear guidelines for security token offerings, creating a predictable framework for institutional adoption. Meanwhile, Singapore’s MAS has actively promoted blockchain innovation through its Project Guardian initiative, which explores asset tokenization applications across financial markets. Expert Analysis: The Tokenization Trend Accelerates Financial technology analysts observe that Flow Capital’s announcement reflects a broader institutional trend toward asset tokenization. According to recent data from the Digital Asset Research Institute, tokenized real-world assets could represent a $16 trillion market opportunity by 2030. Private credit funds, with their predictable cash flows and institutional investor base, present particularly suitable candidates for blockchain transformation. Major global banks, including JPMorgan and Goldman Sachs, have launched similar tokenization projects for treasury and repo markets, validating the technology’s institutional viability. The Asian market demonstrates particular momentum in this sector. Hong Kong positioned itself as a digital asset hub following its 2023 regulatory framework implementation. Singapore established itself as a blockchain innovation center through consistent regulatory clarity and government support. Consequently, Flow Capital’s Hong Kong-Singapore collaboration leverages strengths from both financial centers, creating a model that other asset managers will likely emulate. Market Impact and Investor Implications Tokenization fundamentally alters the private credit investment landscape for institutional and accredited investors. Traditionally, private credit investments require substantial minimum commitments, often exceeding $1 million, with limited secondary market options. Tokenization potentially reduces minimum investment sizes through fractional ownership while creating infrastructure for future liquidity solutions. However, regulatory restrictions on token trading mean secondary markets will develop gradually within approved frameworks. The $150 million fund will focus on senior secured loans to mid-market companies across Asia, particularly in technology, healthcare, and consumer sectors. Token holders will receive periodic distributions representing interest payments from the underlying loan portfolio. Blockchain technology enables near-real-time transparency into fund performance and underlying asset quality, a significant improvement over traditional quarterly reporting cycles. Tokenized Private Credit Fund Structure Component Traditional Fund Tokenized Fund Minimum Investment $1M+ Potentially lower through fractionalization Transparency Quarterly reports Near real-time blockchain data Settlement Time T+2 or longer Near instantaneous Administrative Cost 1-2% annually Potentially reduced through automation Secondary Market Limited, negotiated Protocol-enabled potential Institutional investors increasingly demand blockchain-based solutions for operational efficiency and enhanced risk management. A 2024 survey by Institutional Investor Magazine revealed that 68% of allocators to private credit expressed interest in tokenized fund structures. Their primary motivations include improved transparency, reduced counterparty risk through smart contracts, and potential for portfolio customization through token composability. Future Expansion and Industry Trajectory Flow Capital’s roadmap extends beyond the initial $150 million tokenization. The planned $30 million equity token offering represents a innovative approach to fund manager capitalization. Equity tokens will provide exposure to management fees and performance fees, creating a different risk-return profile compared to the credit fund tokens. This dual-token structure allows investors to choose their preferred exposure to the platform’s economics versus its underlying assets. The financial industry watches this development closely as a potential blueprint for broader adoption. Successful execution could encourage other asset managers to tokenize portions of their private market portfolios. Meanwhile, regulators monitor these developments to ensure investor protection and financial stability. The Hong Kong Monetary Authority recently published discussion papers on tokenization risks and opportunities, indicating ongoing regulatory engagement with this evolving sector. Technological advancements continue to support this trend. Zero-knowledge proofs enable transaction privacy on transparent blockchains, addressing institutional concerns about information leakage. Cross-chain interoperability protocols facilitate token movement between different blockchain networks. Additionally, regulatory technology (RegTech) solutions automate compliance with know-your-customer (KYC) and anti-money laundering (AML) requirements across jurisdictions. Conclusion Flow Capital’s decision to tokenize its $150 million private credit fund represents a significant advancement in financial technology adoption. This initiative demonstrates how blockchain technology addresses specific pain points in private market investing through enhanced transparency, operational efficiency, and potential liquidity improvements. The Hong Kong-based asset manager’s partnership with Singapore’s DigiFT platform creates a compelling cross-border model for institutional tokenization. As the financial industry continues its digital transformation, tokenized private credit funds will likely become increasingly common, fundamentally reshaping how institutions allocate capital to alternative assets. Flow Capital’s ambitious expansion plans, targeting $250 million in total assets, indicate strong conviction in both the underlying credit opportunities and the tokenization model’s long-term viability. FAQs Q1: What does it mean to tokenize a private credit fund? Tokenization converts ownership rights in a private credit fund into digital tokens on a blockchain. These tokens represent fractional ownership in the fund’s underlying loan portfolio, enabling potentially lower minimum investments, enhanced transparency through distributed ledger technology, and infrastructure for future secondary market trading. Q2: Why did Flow Capital choose DigiFT as its blockchain platform? Flow Capital selected DigiFT because it operates under Singapore’s regulatory framework with licensing from the Monetary Authority of Singapore. The platform specializes in real-world asset tokenization with institutional-grade security features, compliance protocols, and a proven track record in regulated financial environments. Q3: How will the equity tokens differ from the fund tokens? Equity tokens represent ownership in Flow Capital’s management company, providing exposure to management and performance fees. Fund tokens represent direct ownership in the underlying credit assets. This creates two distinct investment products with different risk-return profiles within the same ecosystem. Q4: What are the main benefits of tokenizing private credit funds? Primary benefits include enhanced transparency through real-time blockchain data, reduced administrative costs through smart contract automation, potential for fractional ownership lowering investment minimums, and infrastructure development for future secondary market liquidity. Additionally, blockchain enables improved compliance and audit trails. Q5: How does this initiative fit within Hong Kong’s financial strategy? Hong Kong positioned itself as a digital asset hub through its 2023 regulatory framework for virtual assets. Flow Capital’s tokenization project aligns with this strategic direction, demonstrating institutional adoption of blockchain technology while operating within the Securities and Futures Commission’s guidelines for security token offerings. This post Tokenize Private Credit Fund: Flow Capital’s Revolutionary $150M Blockchain Move first appeared on BitcoinWorld .
17 Apr 2026, 04:08
XRP Price Surges Above Key Level, Bulls Take Full Control
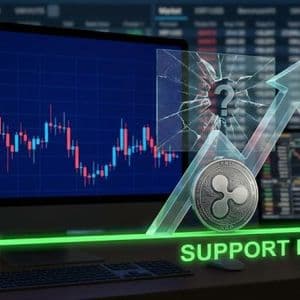
XRP price started a decent increase above $1.40. The price is now consolidating gains and might aim for more gains above the $1.4650 zone. XRP price started a steady increase above the $1.4120 zone. The price is now trading above $1.420 and the 100-hourly Simple Moving Average. There is a bullish trend line forming with support at $1.4220 on the hourly chart of the XRP/USD pair (data source from Kraken). The pair could continue to move up if it settles above $1.4650. XRP Price Extends Gains above $1.420 XRP price started a fresh upward move above $1.380 and $1.3880, like Bitcoin and Ethereum . The price gained pace for a clear move above the $1.40 resistance. The bulls even pumped the price toward the $1.4650 zone. A high was formed at $1.4664, and the price started a consolidation phase. There was a minor decline below the 23.6% Fib retracement level of the upward move from the $1.3510 swing low to the $1.46444 high. The price is now trading above $1.420 and the 100-hourly Simple Moving Average. Besides, there is a bullish trend line forming with support at $1.4220 on the hourly chart of the XRP/USD pair. If there is a fresh upward move, the price might face resistance near the $1.4420 level. The first major resistance is near the $1.450 level, above which the price could rise and test $1.4650. A clear move above the $1.4650 resistance might send the price toward the $1.4840 resistance. Any more gains might send the price toward the $1.50 resistance. The next major hurdle for the bulls might be near $1.5150. Downside Correction? If XRP fails to clear the $1.4650 resistance zone, it could start a fresh decline. Initial support on the downside is near the $1.4220 level. The next major support is near the $1.4080 level or the 50% Fib retracement level of the upward move from the $1.3510 swing low to the $1.46444 high. If there is a downside break and a close below the $1.4080 level, the price might continue to decline toward $1.3880. The next major support sits near the $1.3650 zone, below which the price could continue lower toward $1.350. The main support could be $1.3320. Technical Indicators Hourly MACD – The MACD for XRP/USD is now gaining pace in the bullish zone. Hourly RSI (Relative Strength Index) – The RSI for XRP/USD is now above the 50 level. Major Support Levels – $1.4080 and $1.3880. Major Resistance Levels – $1.4500 and $1.4650.


