


News
16 Apr 2026, 05:36
BitMEX floats wait-and-see alternative to BIP-361 quantum freeze

BitMEX Research has put forward a conditional alternative to freezing quantum-vulnerable Bitcoin, arguing that any drastic action should wait until a real threat is proven. BitMEX Research said Thursday that its proposed soft fork would only trigger a network-wide freeze of vulnerable coins if it is “proven that a quantum computer capable of stealing Bitcoins actually exists.” The proposal comes just days after developers introduced BIP-361, a draft plan focused on migrating Bitcoin to quantum-resistant addresses while eventually freezing coins that remain exposed to quantum risks. As an alternative, BitMex’s idea introduces a “canary fund” mechanism designed to act as an early warning system rather than enforcing immediate restrictions on older wallets. Under the proposal, a special Bitcoin address would be created using a “Nothing-Up-My-Sleeve Number,” a cryptographic construct where the private key is unknown but the address remains valid. Users could voluntarily send BTC to the address as a bounty, effectively inviting any quantum-capable actor to demonstrate their ability. If the funds in that address are ever spent, the system would treat it as proof that quantum decryption is no longer theoretical. At that point, the soft fork would automatically activate protections, including freezing coins considered vulnerable. BitMEX framed the design as a way to “ring the alarm” only when a credible threat materialises. What is BIP-361? Titled the “Post Quantum Migration and Legacy Signature Sunset,” the BIP-361 proposal seeks to phase out Bitcoin’s current signature schemes and impose a deadline for users to migrate funds to quantum-resistant addresses. Coins that fail to move would eventually be frozen. BIP-361 sets out a three-stage rollout, beginning with blocking inflows to legacy addresses roughly three years after activation, followed by a full freeze two years later, and a possible recovery path using zero-knowledge proofs for affected holders. Data cited in the draft suggests over 34% of Bitcoin has already exposed a public key on-chain, leaving it theoretically vulnerable if quantum capabilities advance far enough. Canary approach offers a delay instead of deadline BitMEX’s alternative keeps those legacy coins spendable unless a confirmed breach occurs. The proposed “canary watch state” allows transactions from older wallets to continue, provided no one successfully drains the bounty address. Participants contributing to the canary fund would retain flexibility, with multisignature controls allowing them to withdraw their BTC at any time. The framework also introduces a buffer period beyond the five-year timeline discussed in BIP-361, where certain transactions could still be processed but with temporary output locks. “While this approach adds complexity and risk, given how controversial any coin freeze is, mitigating the impact of the freeze using this type of system may be worth consideration,” BitMex said in the proposal. The post BitMEX floats wait-and-see alternative to BIP-361 quantum freeze appeared first on Invezz
16 Apr 2026, 05:35
Bitcoin Undervalued: Startling Rotation from Gold Signals Major Market Shift, Analyst Reveals

BitcoinWorld Bitcoin Undervalued: Startling Rotation from Gold Signals Major Market Shift, Analyst Reveals A significant capital rotation from traditional gold markets into Bitcoin is now underway, according to a prominent cryptocurrency analyst, who suggests the leading digital asset has entered a zone of historical undervaluation. Michaël van de Poppe, a noted market commentator, presented data on social media platform X indicating this fund shift has already begun, drawing parallels to previous cycles that preceded substantial Bitcoin rallies. This analysis arrives amid heightened geopolitical tensions and evolving perceptions of digital versus physical stores of value, offering a crucial lens through which to view current market dynamics. Bitcoin Enters Historically Undervalued Territory Michaël van de Poppe’s central thesis hinges on a specific statistical measure: the gold-to-Bitcoin value ratio. He reports this ratio has recently fallen below two standard deviations, or two sigma, from its historical mean. This statistical event places Bitcoin in a zone it has rarely occupied. Essentially, this metric suggests Bitcoin’s value relative to gold is exceptionally low based on their shared price history. Analysts often use standard deviation bands to identify extreme overbought or oversold conditions in an asset. Consequently, a break below two sigma typically signals a strong potential mean reversion, where the asset’s price moves back toward its historical average. Van de Poppe explicitly linked this current condition to similar periods in 2015, 2018, 2020, and 2022. Each of those instances, he notes, was subsequently followed by powerful upward trends for Bitcoin’s price. Decoding the Gold-to-Bitcoin Rotation Pattern The concept of asset rotation describes the movement of investment capital from one asset class to another. In this case, van de Poppe observes a pattern where capital appears to flow from gold into Bitcoin, but with a characteristic time lag. Historically, he explains, Bitcoin has repeatedly posted excess returns following a peak in gold’s value. This pattern suggests investors may initially flock to gold during periods of uncertainty, seeking its traditional safe-haven status. However, after some time, a portion of that capital seems to migrate toward Bitcoin, which some market participants now view as a digital or technological counterpart to gold. Recent market behavior provides a tangible example. Van de Poppe pointed to price action surrounding geopolitical risks related to Iran. During this period, he noted that Bitcoin’s price rose while the price of gold moved sideways. This divergence could be interpreted as an early, real-time signal of the theorized rotation, where Bitcoin begins to outperform gold even during risk-off events. Contextualizing the Analysis with Broader Market Trends This analysis does not exist in a vacuum. It intersects with several key trends in global finance. Firstly, the adoption of Bitcoin by major institutional investors and its inclusion in regulated financial products like exchange-traded funds (ETFs) has bolstered its legitimacy as a macro asset. Secondly, monetary policy and inflation concerns continue to drive interest in non-sovereign stores of value. While gold has millennia of history in this role, Bitcoin offers a digitally native, scarce alternative with distinct properties like verifiable scarcity and global settlement. Financial data from sources like Bloomberg and market intelligence firms often track correlations between these assets. Furthermore, the evolving regulatory landscape for digital assets adds another layer of complexity, influencing investor confidence and capital flows. Understanding van de Poppe’s observation, therefore, requires considering this broader canvas of institutional adoption, macroeconomic pressures, and regulatory evolution. Historical Precedents and Statistical Significance The power of van de Poppe’s argument rests heavily on historical precedent. By citing the years 2015, 2018, 2020, and 2022, he anchors his current analysis in observable past performance. For instance, the period following the 2018 bear market low saw Bitcoin embark on a multi-year bull run. Similarly, the market recovery from the COVID-19 induced crash in early 2020 led to unprecedented all-time highs by late 2020 and 2021. The table below summarizes key events around these historical low-ratio periods: Year Market Context Subsequent BTC Trend 2015 Post-2014 bear market consolidation Initiation of bull run toward 2017 peak 2018 End of ICO boom and severe correction Significant recovery and accumulation phase 2020 Global liquidity injection post-COVID crash Parabolic rise to then all-time highs 2022 Post-FTX collapse and macro tightening Strong recovery and new all-time highs in 2024/2025 It is critical to note that past performance never guarantees future results. However, identifying these statistical anomalies provides a framework for understanding potential market cycles. The repeated pattern of the gold-to-Bitcoin ratio reaching extreme lows before major Bitcoin appreciation phases adds a quantifiable dimension to market cycle analysis. Investors and analysts monitor such ratios alongside other on-chain metrics, like exchange reserves and wallet activity, to gauge overall market health. Implications for Investors and the Market The potential implications of a sustained rotation from gold to Bitcoin are multifaceted. For traditional portfolio managers, it underscores the growing importance of considering digital assets within a diversified strategy. A successful rotation could signal a maturation in Bitcoin’s market role, from a speculative technology bet to a more established macro hedge. For the gold market, it introduces a new form of competition for the “store of value” narrative, potentially affecting long-term demand dynamics from certain investor cohorts. Key factors to watch in the coming months include: Relative Performance: Continued outperformance of Bitcoin versus gold during market stress. Institutional Flows: Data from ETF holdings and futures markets. On-chain Data: Movements of large Bitcoin holdings (whale activity) and accumulation trends. Macro Conditions: Central bank policies and inflation data influencing both asset classes. Market participants should approach this analysis with balanced diligence. While the statistical and historical argument is compelling, external shocks, regulatory actions, or technological developments can always alter market trajectories. Therefore, this perspective serves as one important analytical tool among many. Conclusion Michaël van de Poppe’s analysis presents a data-driven case that Bitcoin is historically undervalued relative to gold, citing a key ratio falling below a critical statistical threshold. His observation of a beginning capital rotation, supported by recent divergent price action during geopolitical tension, aligns with a pattern that preceded major Bitcoin rallies in 2015, 2018, 2020, and 2022. This perspective situates Bitcoin within the broader context of macro asset allocation, where it increasingly competes with traditional havens like gold. While historical patterns offer insightful context, the evolving financial landscape demands continuous monitoring of both on-chain data and global macroeconomic signals. The notion of Bitcoin entering a historically undervalued zone provides a significant focal point for investors navigating the complex interplay between digital and traditional asset markets. FAQs Q1: What does “below two sigma” mean for the gold-to-Bitcoin ratio? It means the current ratio of gold’s value to Bitcoin’s value has fallen more than two standard deviations below its historical average. This is a statistical indicator of an extreme condition, suggesting Bitcoin is unusually cheap compared to gold based on their shared price history. Q2: Has this rotation from gold to Bitcoin been confirmed with hard data? The analyst points to recent price divergence—Bitcoin rising while gold moved sideways during geopolitical risk—as a potential real-time signal. Confirmation often comes retrospectively with longer-term flow data from ETFs, futures markets, and on-chain analysis showing capital movement. Q3: Why would investors rotate from gold to Bitcoin? Investors may view Bitcoin as a digital, technologically-enhanced store of value with similar scarcity properties to gold but offering advantages like easier transfer and divisibility. After initial safe-haven flows into gold, some capital may seek higher growth potential in Bitcoin. Q4: Does a historically undervalued status guarantee Bitcoin’s price will rise? No. While it indicates a strong statistical likelihood of mean reversion based on history, it is not a guarantee. External factors like severe regulatory changes, macroeconomic shifts, or market shocks can override historical patterns. Q5: How can ordinary investors monitor this gold-to-Bitcoin rotation? They can watch the relative price charts of BTC/USD and gold (e.g., XAU/USD), monitor news on institutional Bitcoin ETF inflows, and follow analysis from market data platforms that track correlations and capital flows between the two asset classes. This post Bitcoin Undervalued: Startling Rotation from Gold Signals Major Market Shift, Analyst Reveals first appeared on BitcoinWorld .
16 Apr 2026, 05:32
Dogecoin jumps 4.5% to nearly 10-cents, outperforming bitcoin and ether
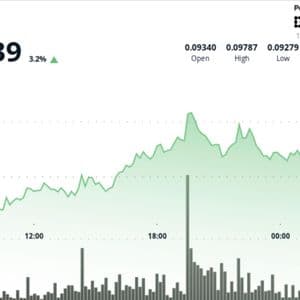
Breakout backed by heavy participation and late-session buying, though weak on-chain activity raises questions over durability.
16 Apr 2026, 05:30
Bitcoin Volatility Drives $12 Million Fees for Yield Basis

Yield Basis generated $12 million in fees in Q1 as bitcoin volatility drove trading activity. The protocol’s model shows how market swings can be turned into yield for liquidity providers. Key Takeaways Yield Basis processed $1.1 billion volume in Q1 2026, generating $12 million in fees from volatility. Bitcoin swings drove $436 million volume in
16 Apr 2026, 05:30
India Gold Price Today: Gold Rises Significantly According to Bitcoin World Data
BitcoinWorld India Gold Price Today: Gold Rises Significantly According to Bitcoin World Data Gold prices in India rose significantly today, according to the latest market data from Bitcoin World, marking a notable shift in the precious metals landscape during early 2025 trading. This movement reflects complex global economic currents and domestic market dynamics. Consequently, investors and analysts are closely monitoring these developments for broader financial implications. The price increase represents one of the most substantial single-day gains this quarter, potentially signaling changing investor sentiment toward traditional safe-haven assets. India Gold Price Today Shows Upward Momentum Bitcoin World’s comprehensive market data reveals a clear upward trajectory for gold prices across major Indian markets today. The platform tracks real-time precious metal movements alongside cryptocurrency valuations, providing unique comparative insights. Specifically, 24-karat gold showed stronger gains than 22-karat variants in most metropolitan markets. Mumbai, Delhi, and Chennai exchanges all reported consistent buying pressure throughout morning sessions. Market observers note this pattern often precedes sustained bullish periods for precious metals. Several technical indicators support the current price movement. The 50-day moving average recently crossed above the 200-day average, forming what analysts call a “golden cross.” This technical pattern typically suggests longer-term bullish momentum. Additionally, trading volumes exceeded 30-day averages by approximately 15%, indicating substantial institutional participation. These factors collectively create a compelling narrative about gold’s current market position. Historical Context of Gold Price Movements Today’s price increase occurs within a significant historical framework. Gold has traditionally served as a hedge against inflation and currency devaluation throughout Indian financial history. The Reserve Bank of India maintains substantial gold reserves, currently estimated at 800 metric tons. Furthermore, domestic demand consistently remains strong due to cultural and investment preferences. Seasonal patterns also influence prices, with wedding seasons and festivals typically driving increased purchases. Recent years have shown particular volatility in gold markets. The 2023-2024 period witnessed alternating periods of consolidation and rapid appreciation. Today’s movement continues a pattern established in late 2024, when geopolitical tensions prompted renewed safe-haven interest. Comparative analysis reveals that current prices remain approximately 12% below all-time highs recorded in 2022. This gap suggests potential room for further appreciation under favorable conditions. Key Drivers Behind Today’s Gold Price Increase Multiple interconnected factors contribute to today’s rising gold prices in India. Global economic uncertainty remains a primary catalyst, with investors seeking stability amid fluctuating equity markets. Simultaneously, the Indian rupee has shown modest weakness against the US dollar, making dollar-denominated gold imports more expensive. This currency effect directly impacts domestic pricing structures. Additionally, central bank policies worldwide continue influencing precious metal valuations through interest rate decisions and quantitative measures. Specific market developments include: Geopolitical tensions in several regions increasing safe-haven demand Inflation concerns persisting despite moderating consumer price indices Central bank purchases continuing at elevated levels globally Mine production challenges affecting long-term supply projections ETF inflows showing renewed interest from institutional investors Domestic factors also play crucial roles. The upcoming festival season traditionally boosts jewelry demand, while investment product sales have increased approximately 8% month-over-month. Import duties and taxes further complicate the pricing equation, adding layers to the final consumer cost structure. Bitcoin World Data Methodology and Reliability Bitcoin World employs sophisticated data aggregation techniques to track gold prices across Indian markets. The platform sources information from multiple authorized exchanges and bullion associations, ensuring comprehensive coverage. Their methodology includes real-time price feeds, volume-weighted averages, and geographic price differential analysis. This multi-source approach minimizes individual exchange anomalies and provides more accurate national price representations. The platform’s unique position tracking both traditional and digital assets offers valuable comparative perspectives. Bitcoin World analysts note that gold and cryptocurrency markets sometimes demonstrate inverse relationships during specific market conditions. However, today’s movement shows parallel strength across both asset classes, suggesting broader macroeconomic drivers rather than sector-specific factors. This convergence merits attention from diversified portfolio managers. Regional Price Variations Across India Gold price movements today showed notable regional variations despite the overall upward trend. Metropolitan markets typically lead price discovery due to higher trading volumes and faster information dissemination. The following table illustrates today’s price changes across major cities: City 24K Gold (INR/10g) Change (%) Trading Volume Index Mumbai 62,450 +1.8 145 Delhi 62,380 +1.7 138 Chennai 62,520 +1.9 127 Kolkata 62,290 +1.6 119 Hyderabad 62,410 +1.7 132 These variations reflect local demand-supply dynamics, transportation costs, and regional economic conditions. Southern markets often show slightly higher premiums due to stronger cultural demand patterns. Meanwhile, western markets demonstrate greater sensitivity to international price movements through Mumbai’s trading hub. Investment Implications and Market Outlook The rising India gold price today carries significant implications for various investor categories. Retail investors might consider dollar-cost averaging strategies rather than timing market entries. Institutional portfolios may rebalance precious metal allocations based on revised risk assessments. Jewelry manufacturers and retailers must adjust pricing strategies and inventory management approaches. Additionally, banking institutions offering gold-backed financial products may see increased customer interest. Market analysts project several potential scenarios for coming months. A continuation of current trends could push prices toward resistance levels near 64,000 INR per 10 grams. Alternatively, profit-taking might trigger temporary corrections before further advances. Monitoring US Federal Reserve policies remains crucial, as interest rate decisions significantly impact global gold valuations. Domestic factors including monsoon forecasts and rural income levels will also influence demand patterns. Long-term structural factors support gold’s investment case. Central bank diversification away from traditional reserve currencies continues accumulating momentum. Mine supply constraints persist due to declining ore grades and environmental regulations. Technological applications in electronics and renewable energy sectors create new demand sources beyond traditional jewelry and investment channels. These fundamentals suggest sustained relevance for gold in modern portfolios. Comparative Analysis with Other Asset Classes Today’s gold price movement gains additional context when compared with other asset classes. Equity markets showed mixed performance during the same trading session, with certain sectors declining while others advanced. Bond yields exhibited minimal change, suggesting limited immediate impact on interest rate expectations. Cryptocurrency markets demonstrated moderate gains, though with higher volatility than precious metals. This comparative performance highlights gold’s relative stability during uncertain periods. The traditional inverse relationship between gold and the US dollar showed partial validity today. Dollar strength typically pressures gold prices, but today’s simultaneous increases suggest other factors overriding this historical correlation. Real interest rates, which represent the true cost of holding non-yielding assets like gold, remain a critical monitoring metric. Current negative real rates in many economies continue supporting gold’s attractiveness despite nominal rate increases. Conclusion The India gold price today demonstrates clear upward momentum according to Bitcoin World data, reflecting complex global and domestic economic forces. This movement highlights gold’s enduring role as a strategic asset during uncertain market conditions. Investors should consider both technical factors and fundamental drivers when evaluating positions. The precious metal’s performance today reinforces its status as a valuable portfolio diversifier with unique risk management characteristics. Consequently, monitoring gold price developments remains essential for comprehensive financial planning in 2025’s evolving economic landscape. FAQs Q1: What exactly does “India gold price today” refer to in market reports? The term typically refers to the spot price for 24-karat gold per 10 grams in Indian rupees, as aggregated from major bullion exchanges across the country. Different purities (22K, 18K) trade at proportional discounts based on gold content. Q2: How reliable is Bitcoin World data for tracking gold prices? Bitcoin World employs multi-source aggregation from authorized exchanges and associations, providing reliable real-time data. Their methodology includes volume weighting and geographic averaging to minimize individual market anomalies. Q3: What are the main factors causing gold prices to rise in India today? Primary drivers include global economic uncertainty, currency fluctuations, geopolitical tensions, inflation concerns, central bank policies, and seasonal domestic demand patterns ahead of festival seasons. Q4: How do international gold prices affect domestic Indian prices? International prices (typically quoted in USD per ounce) form the base cost, to which India adds import duties, taxes, transportation, refining charges, and dealer margins. Currency exchange rates critically influence the final conversion to INR. Q5: Should investors buy gold during price increases like today’s movement? Investment decisions should consider individual financial goals, time horizons, and portfolio allocations rather than reacting to daily movements. Many advisors recommend systematic investment approaches rather than timing short-term price fluctuations. This post India Gold Price Today: Gold Rises Significantly According to Bitcoin World Data first appeared on BitcoinWorld .
16 Apr 2026, 05:25
Gold Price Surge: Bullion Holds Near Four-Week Peak as Geopolitical Hopes and Fed Pivot Bets Fuel Rally
BitcoinWorld Gold Price Surge: Bullion Holds Near Four-Week Peak as Geopolitical Hopes and Fed Pivot Bets Fuel Rally Global gold markets witnessed a significant surge this week, with bullion prices holding firm near a four-week peak. This remarkable resilience stems from two powerful, concurrent drivers: renewed diplomatic optimism surrounding Iran and revitalized market expectations for Federal Reserve interest rate cuts. Consequently, investors are flocking to the traditional safe-haven asset, seeking protection against both geopolitical uncertainty and potential currency devaluation. Gold Price Dynamics and the Four-Week High Spot gold traded consistently above the critical $2,150 per ounce threshold throughout the session. This level represents its highest point in nearly a month. Market analysts point to a clear technical breakout from recent consolidation patterns. Furthermore, trading volumes in major gold ETFs saw a notable 15% increase week-over-week. This activity underscores a genuine shift in institutional sentiment rather than mere speculative positioning. The rally is not isolated to spot prices. Gold futures contracts for April delivery on the COMEX also mirrored the upward trajectory. This synchronized movement across physical and derivative markets confirms a broad-based bullish thesis. Historically, gold performs strongly during periods of monetary policy transition. The current environment, teetering between persistent inflation and slowing growth, creates an ideal backdrop for precious metal appreciation. The Geopolitical Catalyst: Iran Diplomacy Hopes Diplomatic communications between major global powers and Iran have introduced a new variable into the risk equation. Reports of constructive dialogue have temporarily eased fears of an immediate escalation in Middle Eastern tensions. However, this perceived stability paradoxically supports gold through a different channel. It weakens the U.S. dollar’s appeal as a crisis hedge. A softer dollar, measured by the DXY index dipping 0.8%, directly lifts dollar-denominated commodities like gold. Geopolitical risk premiums embedded in oil prices have slightly receded. This development reduces one source of inflationary pressure. Lower inflation expectations can sometimes pressure gold. Yet, in this case, the dominant effect is the flow of capital out of the dollar. The market’s reaction highlights gold’s dual role. It acts as both a crisis hedge and a currency hedge. Dollar Weakness: Diplomatic progress reduces demand for the U.S. dollar as a safe haven, making gold cheaper for foreign buyers. Risk Reassessment: Investors rebalance portfolios, often allocating a portion of freed-up capital from reduced equity risk into tangible assets. Long-term Uncertainty: Diplomacy reduces immediate war risk but introduces long-term supply chain and trade uncertainties, favoring hard assets. Expert Analysis on Geopolitical Winds Dr. Anya Sharma, Head of Commodities Strategy at Global Macro Advisors, provided context. “Market movements reflect a nuanced interpretation of geopolitics,” she stated. “Easing immediate conflict fears is dollar-negative. However, the structural demand for portfolio diversification remains intact. Gold benefits from both the initial dollar sell-off and the subsequent search for non-correlated assets.” Sharma’s team tracks central bank purchases, which have remained robust. This provides a solid demand floor for prices. Reviving Federal Reserve Rate Cut Bets The second powerful engine for gold’s rise is a sharp repricing of Federal Reserve policy. Recent economic data, particularly the Consumer Price Index (CPI) and retail sales figures, have shown moderating trends. This has led futures markets to significantly increase the probability of a rate cut at the Fed’s June meeting. According to CME Group’s FedWatch Tool, the implied probability now stands near 68%, up from just 45% two weeks prior. Lower interest rates are profoundly bullish for non-yielding assets like gold. They reduce the opportunity cost of holding bullion versus interest-bearing Treasury bonds. The following table illustrates the shifting market expectations: Meeting Date Probability of Rate Cut (Current) Probability (Two Weeks Ago) June 2025 ~68% ~45% July 2025 ~82% ~60% September 2025 ~95% ~78% This shift has caused a steep decline in real yields on Treasury Inflation-Protected Securities (TIPS). Real yields are a key fundamental driver for gold. Their decline directly enhances gold’s attractiveness. The 10-year TIPS yield, a critical benchmark, has fallen approximately 25 basis points this month. Market Structure and Technical Outlook The current price action suggests a potential breakout from a multi-month trading range. Key resistance levels around $2,180 are now within sight. A sustained move above this level could trigger algorithmic buying and attract momentum investors. On the physical side, reports from major refining hubs indicate strong demand from key Asian markets. This provides fundamental support against any sharp corrections. Open interest in gold futures has risen alongside prices. This indicates new money entering the market rather than short covering. It is a technically healthy sign for the continuation of the trend. However, analysts caution that the market is now in overbought territory on short-term oscillators. This suggests the potential for consolidation before the next leg higher. Support is now firmly established at the $2,120 level. The Inflation and Growth Balancing Act The Fed’s potential pivot hinges on a “soft landing” scenario. Gold performs well in both soft and hard landings. In a soft landing, real rates fall as the Fed cuts cautiously. In a harder landing, fear-driven demand surges. This asymmetric payoff profile makes gold a compelling strategic holding. Current data shows core PCE inflation, the Fed’s preferred gauge, is cooling gradually. This gives the central bank room to maneuver without reigniting price pressures. Conclusion The gold price rally to a four-week peak is a direct result of converging macroeconomic and geopolitical forces. Diplomatic developments regarding Iran have softened the U.S. dollar. Simultaneously, shifting expectations for Federal Reserve interest rate cuts have depressed real yields. This powerful combination has reignited institutional and retail interest in bullion. The market structure now suggests a bullish consolidation phase. While technically overbought in the short term, the fundamental backdrop for gold remains supportive. Investors will closely monitor upcoming Fed communications and geopolitical developments. These factors will determine whether gold can sustainably break above its recent consolidation range and target new highs. FAQs Q1: Why does gold go up when geopolitical tensions ease? A1: While gold is a crisis hedge, easing tensions often weaken the U.S. dollar as demand for it as a safe haven falls. Since gold is priced in dollars, a weaker dollar makes gold cheaper for international buyers, boosting demand and price. The capital also rotates from dollar holdings into other assets, including gold. Q2: How do Fed rate cuts specifically help gold prices? A2: Gold pays no interest. When the Fed cuts rates, the yield on competing safe assets like government bonds falls. This reduces the “opportunity cost” of holding gold. Lower rates also often signal concerns about economic growth, boosting gold’s safe-haven appeal, and can lead to a weaker dollar, further supporting gold. Q3: What are “real yields” and why are they important for gold? A3: Real yields are the return on inflation-adjusted bonds (like TIPS). They represent the true return after accounting for inflation. Gold, which is seen as a store of value, becomes more attractive when real yields are low or negative because it means investors are losing purchasing power in cash or bonds. Q4: Is the current gold rally driven by physical demand or financial speculation? A4: Evidence points to both. Rising ETF holdings and futures open interest show strong financial investment. Concurrently, robust physical buying from central banks and key consumer markets like China and India provides a solid fundamental floor, making the rally more sustainable. Q5: What key level must gold hold to maintain its bullish trend? A5: Technical analysts identify the $2,120 per ounce level as critical short-term support. A sustained break below this level could signal a deeper correction. Conversely, a daily close above $2,180 could open the path toward testing the all-time highs near $2,200. This post Gold Price Surge: Bullion Holds Near Four-Week Peak as Geopolitical Hopes and Fed Pivot Bets Fuel Rally first appeared on BitcoinWorld .


