


 Invest ideas
News
27 May 2026, 13:30
Ethereum Risks Drop to $1,800 as Daily Chart Support Weakens

BitcoinWorld Ethereum Risks Drop to $1,800 as Daily Chart Support Weakens Ethereum (ETH) faces a critical test in the coming sessions as the cryptocurrency’s price hovers near the lower boundary of a daily ascending channel that has contained its movements since February. Technical analysts warn that a decisive break below this support level could open the door for a decline toward the $1,800 demand zone, representing a potential drop of over 18% from current levels. Bearish Pressure Builds After May Resistance Rejection The bearish outlook for ETH has been building since mid-May, when the price encountered strong resistance near the $2,400 mark. Since that rejection, Ethereum has been trading in a descending pattern, with each rally attempt meeting selling pressure. The 100-day moving average, currently situated around $2,200, has emerged as the primary resistance level that bulls must overcome to shift the near-term trend. At present, ETH is barely holding onto the lower support line of the ascending channel, a structure that has guided price action for several months. This support line has been tested multiple times since February, but each previous test resulted in a bounce. The current test, however, comes amid broader weakness in the cryptocurrency market and reduced risk appetite among traders. Key Levels to Watch: $1,800 Support and $2,200 Resistance Should the channel support fail to hold, the next major support level is identified as the $1,800 demand zone. This area has historically attracted buying interest and could provide a floor for the price if a breakdown occurs. A move to $1,800 would represent a significant retracement from the year’s highs and would likely trigger increased volatility and trading volume. On the upside, Ethereum must first reclaim the 100-day moving average near $2,200 to signal a potential reversal of the current downtrend. A sustained move above this level would indicate that buying pressure is returning and could pave the way for a retest of the $2,400 resistance zone. However, until such a breakout occurs, the path of least resistance remains to the downside. What This Means for Traders and Investors For short-term traders, the current setup presents a clear risk-reward scenario. A breakdown below the channel support could lead to rapid selling, while a bounce from the support line could offer a quick trading opportunity. Long-term investors, however, may view a potential drop to $1,800 as a buying opportunity, given Ethereum’s fundamental role in the decentralized finance (DeFi) and non-fungible token (NFT) ecosystems. The broader market context is also important. Ethereum’s price action is influenced by macroeconomic factors, including interest rate expectations and regulatory developments. Any negative news on these fronts could accelerate the decline, while positive catalysts could help the price stabilize. Conclusion Ethereum is at a pivotal juncture, with the daily ascending channel support acting as the last line of defense against a deeper correction. A break below this level would likely target the $1,800 demand zone, while a successful hold could lead to a recovery toward the 100-day moving average. Traders should monitor these key levels closely in the coming days for confirmation of the next directional move. FAQs Q1: What is the ascending channel pattern in Ethereum’s daily chart? The ascending channel is a technical pattern formed by two parallel upward-sloping trend lines. The upper line represents resistance, and the lower line represents support. Ethereum has been trading within this channel since February, and a break below the lower support line would signal a bearish reversal. Q2: Why is the $1,800 level important for Ethereum? The $1,800 level is a key demand zone where buyers have historically stepped in to support the price. It also represents a significant psychological round number and a potential area of technical support based on previous price action. Q3: What could trigger a reversal in Ethereum’s price? A reversal would require Ethereum to reclaim the 100-day moving average near $2,200 with strong volume. Positive catalysts such as favorable regulatory news, increased institutional adoption, or a broader market rally could also help shift momentum in favor of the bulls. This post Ethereum Risks Drop to $1,800 as Daily Chart Support Weakens first appeared on BitcoinWorld .
27 May 2026, 13:30
Bitcoin: How $1.29B in BlackRock IBIT trades sparked BTC ETF outflows

IBIT sales drove 4.32K BTC outflows worth $324M, with daily trading volume hitting $6.07 billion.
27 May 2026, 13:26
Bitcoin price drops as BlackRock’s IBIT sells over $1 billion in a day

Bitcoin ( BTC ) price was rejected again at last week’s resistance level around $78,000 over the past 24 hours, following a massive single sale from BlackRock’s iShares Bitcoin Trust ( IBIT ) On May 27, BTC price had dropped nearly 2% over the past 24 hours, trading at approximately $75,680 at press time. As such, its market capitalization slipped by nearly $30 billion during the same period to hover about $1.5 trillion at the time of reporting. BTC/USD 24-hour chart. Source: Finbold The flagship coin experienced heightened selling pressure on Wednesday, largely fueled by a notable sale from an IBIT investor. On May 26, BlackRock’s IBIT recorded its largest single sale of $1.289 billion through a dark pool – an alternative trading system where large institutional investors can buy or sell securities anonymously. Precisely, a sale order of 29,212,864 IBIT shares was initiated on Tuesday, as the fund’s stock price hovered around $43.16, based on data from Bloomberg . IBIT stock traded on May 26. Source: Bloomberg What’s next for Bitcoin amid IBIT sell-off Following the notable selloff of IBIT on Tuesday, the fund has now registered seven consecutive days of cash outflows. After closing the day with a net liquidation of $192.44 million, based on metrics from SoSoValue , IBIT has now seen a net outflow of $1.33 billion over the past seven days. IBIT daily cash flow. Source: SoSoValue Amid the ongoing sell-off in U.S. spot BTC exchange-traded funds (ETFs), Finbold AI Agent – an advanced financial assistance tool – has predicted further selling over the coming days. BTC price prediction for 7 days. Source: Finbold The Finbold AI Agent predicted that BTC price could drop nearly 4% to retest its support level at about $72,884 by June 3, 2026. The post Bitcoin price drops as BlackRock’s IBIT sells over $1 billion in a day appeared first on Finbold .
27 May 2026, 13:25
Solana DEX Orca Launches Tokenized Real-World Asset Marketplace
BitcoinWorld Solana DEX Orca Launches Tokenized Real-World Asset Marketplace Solana-based decentralized exchange Orca has introduced a marketplace dedicated to tokenized real-world assets (RWAs), marking a significant step in bridging traditional finance with decentralized finance (DeFi). The platform’s first tradable asset is GLDY, a token pegged to the price of gold, issued by tokenization firm Streamex. Permissioned Pools for Institutional-Grade Trading Unlike Orca’s existing permissionless trading pools, the new RWA marketplace operates on a permissioned pool system. This means only approved investors, who have passed identity verification and compliance checks, are eligible to trade GLDY and future assets listed on the platform. This design choice reflects the regulatory requirements often associated with tokenized securities and commodities, ensuring the marketplace remains compliant with applicable laws. The launch positions Orca among a growing number of DeFi protocols exploring RWA tokenization, a sector that has gained traction as institutions seek on-chain exposure to assets like gold, real estate, and bonds. By leveraging Solana’s high throughput and low transaction costs, Orca aims to offer efficient trading for these tokenized assets. Why This Matters for the Broader Crypto Market The tokenization of real-world assets represents a convergence of traditional and decentralized finance. For investors, it offers the potential for fractional ownership, 24/7 trading, and greater liquidity for assets like gold that have historically been less accessible in digital form. For the Solana ecosystem, Orca’s move could attract a new wave of institutional liquidity and users interested in regulated on-chain asset trading. Implications for DeFi and Regulation The permissioned nature of the marketplace highlights the evolving relationship between DeFi platforms and regulatory frameworks. While permissionless trading is a core tenet of DeFi, the RWA market’s compliance-focused approach may serve as a template for other protocols seeking to offer tokenized securities. This balance between decentralization and regulation will be a key theme as the sector matures. Conclusion Orca’s launch of a tokenized RWA marketplace on Solana, starting with a gold-pegged token, signals growing institutional interest in regulated on-chain asset trading. By using permissioned pools, the platform navigates compliance requirements while offering the efficiency of a decentralized exchange. The success of this initiative could influence how other DeFi protocols approach real-world asset tokenization in the future. FAQs Q1: What is the Orca RWA marketplace? It is a new section of the Orca decentralized exchange on Solana where users can trade tokenized versions of real-world assets, starting with a gold-pegged token called GLDY. Q2: Who can trade on the Orca RWA marketplace? Only approved investors who have passed identity verification and compliance checks can trade, as the marketplace uses permissioned pools rather than open, permissionless ones. Q3: What is GLDY? GLDY is a token issued by Streamex that is pegged to the price of gold, allowing investors to gain exposure to gold’s value on the blockchain. This post Solana DEX Orca Launches Tokenized Real-World Asset Marketplace first appeared on BitcoinWorld .
27 May 2026, 13:21
Bitcoin Sinking Amid Persistent ETF Outflows: More Pain Ahead?

Apart from a brief rally up to $78K, the $BTC price is continuing to make its way lower. What is certainly a bearish factor weighing on price is the persistent outflow from the Spot Bitcoin ETFs. With the last 6 days resulting in negative outflows, what chance does Bitcoin have to buck this downtrend? 7th straight day of ETF outflows Source: Coinglass A total of just over 24K BTC leaving the U.S. Spot Bitcoin ETFs over the last 7 trading days does not instil a lot of confidence into Bitcoin investors. Will this have the effect of forcing the $BTC price down into the last stage of this bear market? A pattern forming that could take $BTC up to $81K? Source: TradingView It doesn’t seem that long ago that the $BTC price was vying strongly to break out above the bear flag, a feat that would have been incredibly bullish had it succeeded. Instead, rejection was the final decision, and the price has been steadily moving lower ever since. The price has flipped to the outside of the small descending channel , and probably the next move to be expected is for the price to lose touch with the bottom of the channel and perhaps speed up to the downside. That said, price often does the unexpected, and there is actually a pattern forming that could turn the tide back in favour of the bulls. This is an inverse head and shoulders which is forming to the underside of the descending channel. If the $BTC price comes back up to touch the channel bottom trendline this completes the pattern. It just then remains to be seen if the pattern breaks to the upside or fails. The upside measured move would be to $81K which could coincide with the top of the small channel. $BTC price back in lower half of bear flag Source: TradingView Looking at the current bear flag in the daily time frame the demarcation of the price action between the top and bottom of the flag can clearly be seen. The midpoint of the flag is having as much of an influence on the price action as the top and bottom trendlines of the flag. The $BTC price is below the midpoint now, so it is going to take a decent spurt to the upside from the bulls in order to break through to the top half of the flag again. With the Stochastic RSI indicator lines looking as though they are going to roll over, the upside momentum signal is not there, at least on this time frame. Perhaps the 4-hour time frame could provide that momentum? Fibonacci levels predict 2 potential bear market bottoms Source: TradingView Zooming right the way out into the monthly time frame may put your mind at rest if you are a long-term investor. Look at the Fibonacci lines for the entirety of this bull/bear cycle. When the $BTC price came down to that $60,000 level many analysts assumed it would be the bottom (it still may be). That said, this bottom did not quite tag the 0.618 Fibonacci level, which is surely the minimum retracement level for a full-scale bear market? Is the price going to end up coming down to this level eventually? This would be well within the limits of a double bottom, and would appear to be a great place for the price to start on the next bull run, keeping in line with support levels from the previous bull market double top. Or, is the price going to come all the way down to the 0.786 Fibonacci level? This lines up fairly closely with the $40K bottom that some analysts are favouring across social media. The answer may well coincide with what happens to the monthly Stochastic RSI indicator lines. If they continue to rise and get above the 20.00 level, there would probably only be time for the price to perhaps dip quickly down to the 0.618 level, but if the lines stay at the bottom for a lengthy period, as happened for the entirety of 2022, then we could see a dip to $40K and the 0.786 - the deepest of the Fibonacci levels. Disclaimer: This article is provided for informational purposes only. It is not offered or intended to be used as legal, tax, investment, financial, or other advice.
27 May 2026, 13:20
CoinDesk 20 performance update: Internet Computer (ICP) Jumps 9.8%
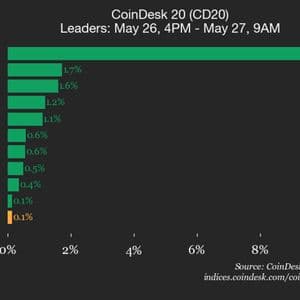
Stellar (XLM), up 1.7%, joined Internet Computer (ICP) as a top performer.


